Search Results
Showing results 81 to 100 of 126
Shower Estimation
Source Institutions
In this activity, learners calculate their water usage (in cups and galloons) during an average shower. Learners also chart and analyze water usage during showers in their households.
Hanford at the Half-Life Radiation Calculator
Source Institutions
This quiz lets you estimate your annual radiation exposure.
What is a "Model"?
Source Institutions
In this activity, learners simulate the behavior of the atmosphere.
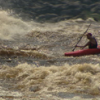
Evolution in Action: Isolation and Speciation in the Lower Congo River
Source Institutions
In this guided discussion activity, learners watch a video about Central Africa's Lower Congo River, one of the most biologically diverse rivers in the world.
Making a Field Journal
Source Institutions
In this activity, Christina Elson, an archaeologist from the American Museum of Natural History, guides learners as they investigate an "artifact" and record their observations in a field journal.

Exploring Earth: Bear’s Shadow
Source Institutions
“Exploring Earth: Bear’s Shadow” is a hands-on activity designed primarily for young visitors and their families. Participants move a flashlight around an object to make and experiment with shadows.
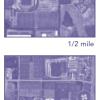
Aerial Imagery
Source Institutions
This activity (on page 2 of the PDF under SciGirls Activity: Earthquakes) is a full inquiry investigation into aerial imagery.

The Dead Zone: A Marine Horror Story
Source Institutions
In this environmental science and data analysis activity, learners work in groups to track a Dead Zone (decreased dissolved oxygen content of a body of water) using water quality data from the Nutrien
The Parachuting Egg
Source Institutions
In this activity, learners work in groups to design a parachute out of household items that keeps an egg secure when dropped from a certain height.
Exploring the Solar System: Big Sun, Small Moon
Source Institutions
“Exploring the Solar System: Big Sun, Small Moon” is a hands-on activity that explores the concept of apparent size and allows visitors to experience this phenomena using familiar objects—a tennis bal
A Day in the Life of a San Francisco Native Animal
Source Institutions
In this activity, students will learn some key information about a San Francisco native animal and then write a firsthand account of their experience from the perspective of that animal in the time be
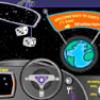
Zoom: Travel to a Star and Back to Earth
Source Institutions
This is an online activity about what would happen if we could travel at or near the speed of light.

Coral Snapshots: Biodiversity in Marine Protected Areas
Source Institutions
In this data activity, learners analyze data from coral reef snapshots taken by scientists at the Virginia Institute of Marine Science.
What Causes Pressure?
Source Institutions
In this kinesthetic activity that demonstrates pressure, learners act as air molecules in a "container" as defined by a rope.
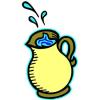
Aesop's Arithmetic
Source Institutions
In this activity (located on page 9 of the PDF), learners are introduced to Aesop's fable, "The Crow and the Pitcher." In the story, a clever crow drops pebbles into a pitcher to cause the water level
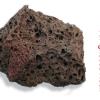
Rock Cycle Roundabout
Source Institutions
In this activity, learners will learn how igneous rock, metamorphic rock, and sedimentary rock are formed as part of the rock cycle and that the same forces that produce/change rocks also produce/chan

Arctic Sea Ice
Source Institutions
In this activity, learners explore how the area of Arctic sea ice has changed over recent years. First, learners graph the area of Arctic sea ice over time from 1979 to 2007.
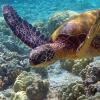
Let's Count Humpback Whales: Environmental Effects on Population
Source Institutions
In this activity, learners use whale count data from the Hawaiian Islands Humpback Whale National Marine Sanctuary to compare whale counts in relation to environmental factors.
Habitat Adaptation Matchup
Source Institutions
In this activity, learners work in small groups to match various marine animals with their different environments.
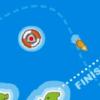
Cup Sailing Game
Source Institutions
In this online Flash game, learners will captain a sailing challenge, adjusting boat direction and sails, seeking the way to take greatest advantage of varying wind speeds and directions to catch the