Search Results
Showing results 1 to 15 of 15
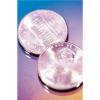
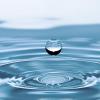
Statistics: Wet Heads
Source Institutions
In this math lesson, learners learn how to construct stem and leaf plots. Learners first estimate the number of drops of water that will fit on the head of a penny.
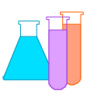
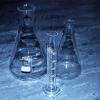
Investigating Density Currents
Source Institutions
In this lab activity, learners explore how to initiate a density current. Learners measure six flasks with different concentrations of salt and water (colored blue).
Linear Functions: Mystery Liquids
Source Institutions
In this math lesson, learners analyze the density of liquids in order to explore linear functions.
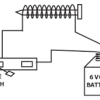
How Do We Convert Electrical Energy into Mechanical Energy?
Source Institutions
In this activity, learners make an electromagnet motor to demonstrate the most basic method of changing electrical energy into mechanical energy.
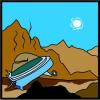
Chances Are: OH NO! Look Out Below for a UFO
Source Institutions
In this math lesson (on Page 13), learners predict and simulate the likelihood of an event occurring.
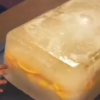
Frozen Fruit
Source Institutions
In this "Sid the Science Kid" activity from Episode 108: My Ice Pops, learners observe reversible change while thinking about ways to make ice melt.
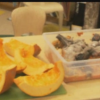
The Decayed Pumpkin
Source Institutions
In this "Sid the Science Kid" activity from Episode 106: My Mushy Banana, learners explore the effects of decay by comparing and contrasting something (an old pumpkin) that's decayed with the same thi

Multi-Variable Relations: Stressed to the Breaking Point
Source Institutions
In this math lesson, learners explore the relationship between the thickness of a spaghetti bridge, the length of the bridge, and the amount of weight that can be supported by the bridge.
Investigating Convection
Source Institutions
This experiment is designed to illustrate how fluids, including water, have the ability to flow.

Tree-mendous Plots
Source Institutions
In this math lesson, learners record and graph plant growth and interpret data. Learners plant seeds, and once the seeds sprout, record the change in height of the plants for several days.
Rates of Change: Bottles and Divers
Source Institutions
In this math lesson (page 2 of the PDF), learners use bottles of various shapes to explore the abstract concept of rate of change.
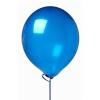
Up, Up, and Away
Source Institutions
In this math lesson, learners explore the real world meaning of slope. Learners conduct a balloon experiment in which they measure the circumference and flight time of deflating balloons.
Drip, Drop, Drip, Drop
Source Institutions
In this math lesson, learners design an experiment to model a leaky faucet and determine the amount of water wasted due to the leak.
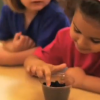
Sunblock Investigation
Source Institutions
In this "Sid the Science Kid" activity, learners set up a simple experiment to find out how sunscreen counteracts the effects of the sun.
Growing Plants
Source Institutions
In this "Sid the Science Kid" activity from Episode 107: My Shrinking Shoes, learners observe how plants change as they grow.