Search Results
Showing results 701 to 720 of 869
This Bitter Be Good
Source Institutions
In this health and genetics activity, learners determine whether tasting the bitter compound PTC (phenylthiocarbamide) influences which vegetables a person likes.
Designer Seeds
Source Institutions
In this activity, learners will examine a variety of seeds, describe them, and determine how they are dispersed.
Mystery of the Disappearing Cottonwoods
Source Institutions
Learners will explore the scientific mystery behind a disappearing group of trees by examining data and attempting to explain the decline.
Secret Writing Devices
Source Institutions
In this activity about encryption, learners cut out a secret decoder badge from a handout and use it to encode messages to each other.
Toothpick Patterns
Source Institutions
In this hands-on activity, learners use toothpicks to build different triangles and squares and then use the toothpicks to build and solve some tricky shape puzzles.
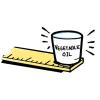
Comparing the Density of Different Liquids
Source Institutions
Learners carefully pour vegetable oil, water, and corn syrup in any order into a cup and discover that regardless of the order they are poured, the liquids arrange themselves in layers the same way.

It's a Gas, Man
Source Institutions
In this activity, learners discover if carbon dioxide has an effect on temperature.

Life Size: What's in a microbe?
Source Institutions
In this activity on page 3 of the PDF, learners visualize the relative size and structural differences between microbes that have the potential to cause disease.
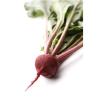
Membrane Permeability with Beets
Source Institutions
In this lab exercise, learners explore diffusion, cell membranes and particle size using beets and three alcohols.
Bouncing Balloons
Source Institutions
In this sports-themed engineering activity, learners create super bouncy balls out of balloons. Learners brainstorm, test their designs, and share results.
Let's Count Humpback Whales: Environmental Effects on Population
Source Institutions
In this activity, learners use whale count data from the Hawaiian Islands Humpback Whale National Marine Sanctuary to compare whale counts in relation to environmental factors.
Coastal Erosion: Where's the Beach?
Source Institutions
Learners use beach profile data from a local beach or online data from Ocean City, Maryland to investigate coastal erosion and sediment transport.
Measuring Biodiversity
Source Institutions
Learners use a variety of beans to represent a variety of species, and scatter these beans over a large piece of paper representing the environment.
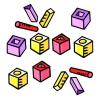
Geometric Solids
Source Institutions
This math activity exposes early learners to a variety of three-dimensional objects. Learners bring geometric solids (everyday objects) from home.
Recycle Your Own Paper!
Source Institutions
In this activity (page 2 of PDF under GPS: Garbology Activity), learners will prepare sheets of homemade recycled paper from several different source pulps.
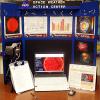
Space Weather Action Center
Source Institutions
In this interdisciplinary activity, learners create a Space Weather Action Center (SWAC) to monitor solar storms and develop real SWAC news reports.
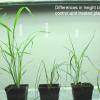
Effect of Environment on Plant Growth
Source Institutions
The purpose of this plant biotechnology activity is to demonstrate the effect of changes in the environment on the growth and fertility of landscape grasses and crop grasses such as wheat and rice.

A Cubic Foot Per Second
Source Institutions
In this activity, learners measure and calculate the amount of cubic feet various containers contain. Next, learners investigate cubic feet per second (cps), by carrying jugs in one second.
Construction and Destruction
Source Institutions
In this three/four-day lesson, learners calculate perimeters and areas and draw the castle plan to scale.
Fruity-Glows: Pictures of Health on a Microarray Canvas
Source Institutions
In this activity (page 12), learners apply the concepts of pixilation and pointillism to the world of biomedical science.