Search Results
Showing results 1 to 12 of 12
Coastal Erosion: Where's the Beach?
Source Institutions
Learners use beach profile data from a local beach or online data from Ocean City, Maryland to investigate coastal erosion and sediment transport.
Sea State: Forecast Conditions at Sea
Source Institutions
In this oceanography and data collection activity, learners cast real time sea state conditions using buoys from NOAA's National Data Buoy Center.
Fish Eyes: More than Meets the Eye
Source Institutions
In this data collection and analysis activity, learners evaluate fish physiology and ecology using vision research data from Dr.
Haunted by Hurricanes: Use Data to Learn About Hurricanes
Source Institutions
In this activity, learners will determine if the frequency and intensity of hurricanes are changing using real data from the National Hurricane Center.
The Return of El Nino
Source Institutions
In this activity related to climate change and data analysis, learners examine temperature and precipitation data to determine if climate variations are due to El Niño.
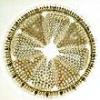
Diatom Ooze: Ooze Clues
Source Institutions
In this activity, learners will plot the distribution of various oozes using information from sediment maps.

Conductivity: Salty Water
Source Institutions
Water, whether fresh or salty, serves as one of the best electrical conductors on the planet. Does salt effect its conductivity?

The Ins and Outs of Tides: Learn About Causes and Predictions
Source Institutions
In this activity, learners will compare predicted and observed tides using data from The National Oceanic and Atmospheric Administration(NOAA).
Tsunami: Waves of Destruction
Source Institutions
In this activity, learners use tsunami time travel maps to predict how long it will take a tsunami to reach the shore.
Waves: An Alternative Energy Source
Source Institutions
In this data analysis and environmental science activity, learners evaluate the feasibility of wave energy as a practical alternative energy source using ocean observing system (OOS) buoys.

Heat Capacity: Can't Take the Heat?
Source Institutions
Why is ocean water sometimes the warmest when the average daily air temperature starts to drop? In this activity, learners explore the differing heat capacities of water and air using real data.

The Dead Zone: A Marine Horror Story
Source Institutions
In this environmental science and data analysis activity, learners work in groups to track a Dead Zone (decreased dissolved oxygen content of a body of water) using water quality data from the Nutrien