Search Results
Showing results 21 to 38 of 38
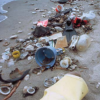
Trash Traits
Source Institutions
In this activity on page 24, learners perform experiments to examine whether or not trash can float, blow around, or wash away.
Off Base
Source Institutions
In this activity, learners explore the factors that tend to resist changes in pH of the ocean and why the ocean is becoming more acidic.
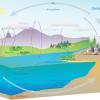
Water, Water Everywhere
Source Institutions
In this activity, learners estimate how much water they think can be found in various locations on the Earth in all its states (solid, liquid, and gas) to discover the different water ratios in the Ea
The Carbon Cycle and its Role in Climate Change: Activity 1
Source Institutions
In this activity (on page 1), learners role play as atoms to explore how atoms can be rearranged to make different materials.
Mountains in the Sea
Source Institutions
In this 6-7 day investigation, learners begin with an introduction to seamounts that are present in the Gulf of Alaska.
Canned Heat
Source Institutions
In this activity, learners explore how light and dark colored objects absorb the Sun's radiations at different rates.
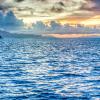
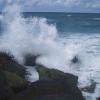
Waves and Tides
Source Institutions
In this 7-10 day investigation, learners develop an understanding of waves and tides and their motion through discussion, demonstration, and hands-on activities.

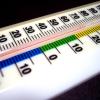
The Daily Ups and Downs
Source Institutions
In this activity, learners graph 48 hourly air temperatures from a local weather observation site and observe the diurnal temperature variations.
Modeling Tidal Action
Source Institutions
In this activity (Lesson 1), learners work in groups to create tide simulations.
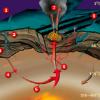
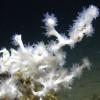
Candy Chemosynthesis
Source Institutions
In this activity, groups of learners work together to create edible models of chemicals involved in autotrophic nutrition.

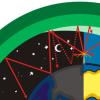
Using Different Models of Earth
Source Institutions
In this activity, learners explore how the shapes, sizes, and distances of land masses appear differently on two different models of Earth: an icosahedron and a flat map.

Arctic Sea Ice
Source Institutions
In this activity, learners explore how the area of Arctic sea ice has changed over recent years. First, learners graph the area of Arctic sea ice over time from 1979 to 2007.

It's a Gas, Man
Source Institutions
In this activity, learners discover if carbon dioxide has an effect on temperature.

Measure the Pressure: The "Wet" Barometer
Source Institutions
In this activity, learners use simple items to construct a device for indicating air pressure changes.

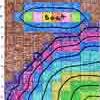
Forward Thinking
Source Institutions
In this activity, learners create their own weather forecast map.
AM in the PM
Source Institutions
In this activity, learners will listen to as many radio stations as possible to discover that AM radio signals can travel many hundreds of miles at night.

Measure the Pressure II: The "Dry" Barometer
Source Institutions
In this activity, learners use simple items to construct a device for indicating air pressure changes.

If Anyone Can, Icon
Source Institutions
In this activity, learners create their own icons for a forecast-at-a-glance poster for their classroom/learning space.