Source Institutions
Source Institutions
Add to list Go to activity
Activity link broken? See if it's at the internet archive
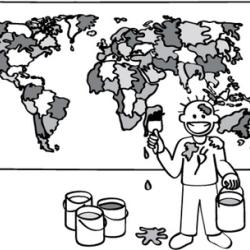
In this activity, learners help a poor cartographer color in the countries on a map, making sure each country is colored a different color than any of its neighbors. Through this exercise, learners discover the "has-to-be" rule and the value of place-holders. This activity reveals the complexity of graph coloring algorithms in computer science. Variations, extensions, background information, and solutions are included in the PDF.
- 5 to 10 minutes
- 30 to 45 minutes
- 1 cent - $1 per group of students
- Ages 6 - 18
- Activity, Lesson/Lesson Plan, Simulation
- English
Quick Guide
Materials List (per group of students)
- Copies of blackline masters on pages 138-141
- Moveable small colored markers (e.g. counters or poker chips)
- Four crayons of different colors (or colored pencils, felt tips, etc.)
- Blackboard or similar writing surface
Subjects
-
Engineering and Technology
-
Computing
- Computer Science
-
Engineering
- Computer Engineering
-
Technology
- Information and Communication
-
Computing
-
Mathematics
-
Algebra
- Patterns
-
Data Analysis and Probability
- Probability
- Representation
-
Algebra
-
The Nature of Technology
-
The Design Process
- Problem Solving
-
The Design Process
Informal Categories
- Arts and Crafts
- Computers
Audience
To use this activity, learners need to:
- see
- see color
- read
- touch
Learning styles supported:
- Involves hands-on or lab activities
Other
Foreign language versions of this resource:
- Greek: Greek language translation
- Polish: Polish language translation
- Slovak: Slovenian language translation
Components that are part of this resource:
Includes alignment to state and/or national standards:
This resource is part of:
Access Rights:
- Free access
By:
- Bell, Tim ; Witten, Ian ; Fellows, Mike
Rights:
- Creative Commons: Non-commercial No Derivatives (by-nc-nd), Computer Science Unplugged, 1995
Funding Sources:
- Brian Mason Scientific and Technical Trust
- Google Inc.