Search Results
Showing results 1 to 11 of 11
Graph Dance
Source Institutions
In this activity, learners "dance" (move back and forth at varying speeds) by reading a graph. This is a kinesthetic way to help learners interpret and understand how motion is graphed.
Heart and Lungs
Source Institutions
In this environmental health activity, learners investigate their breathing and pulse rates, and learn how these measurements are affected by physical activity.
Getting There!: Navigation and Trajectory
Source Institutions
In this two-part activity, learners map a navigation plan to get from Earth to Mars and back. In activity one, learners represent the orbital paths of Earth through dance and dramatic movement.
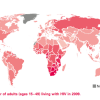
Mapping the Spread of HIV/AIDS: Trailing the Pandemic
Source Institutions
In this activity, learners act as epidemiologists by mapping the prevalence of HIV/AIDS worldwide.
How Many In a Minute
Source Institutions
In this activity, learners will keep track of how much they can do in one minute. Instructors can pick something everyone will do for a minute, such as jumping up and down or drawing stars.

Tree-mendous Plots
Source Institutions
In this math lesson, learners record and graph plant growth and interpret data. Learners plant seeds, and once the seeds sprout, record the change in height of the plants for several days.
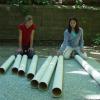
Music and Sound
Source Institutions
This activity (on page 2 of the PDF under SciGirls Activity: Music and Sound) is a full inquiry investigation into sound frequency.
Ride on a Slide: Toys or Tubes Ride Slopes and Angles
Source Institutions
This activity is a hit for family events and all ages—some will finish in 45 minutes; others can go on for hours.
Clay Beams and Columns
Source Institutions
In this activity, learners make or use pre-made clay beams to scale and proportion. Specifically, they discover that when you scale up proportionally (i.e.
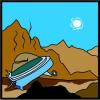
Chances Are: OH NO! Look Out Below for a UFO
Source Institutions
In this math lesson (on Page 13), learners predict and simulate the likelihood of an event occurring.

Arctic Sea Ice
Source Institutions
In this activity, learners explore how the area of Arctic sea ice has changed over recent years. First, learners graph the area of Arctic sea ice over time from 1979 to 2007.