Search Results
Showing results 1 to 14 of 14
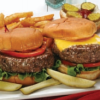
Serving Sizes
Source Institutions
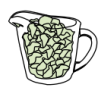
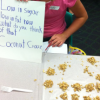
In this nutrition and estimation activity (page 12 of PDF), learners estimate serving sizes of different foods and compare their estimates to serving size information provided on nutrition food labels
Energy For Life
Source Institutions
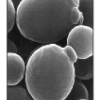
In this activity about the relationship between food and energy (page 1 of PDF), learners observe and quantify the growth of yeast when it is given table sugar as a food source.
The Menu Game at the Terribly Terrific Taco
Source Institutions
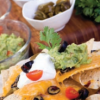
In this math game (Page 15 of the Dining Out! PDF), learners figure discounts and/or profit increases for various food totals. Learners add decimals to $100.
Number Sense and Computation: Food For Thought
Source Institutions
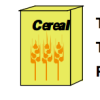
In this math lesson, learners identify and compare unit costs of given items. Learners use computation skills, problem solving and number sense to find the cost of an ounce of cereal.
Do Plants Need Light?
Source Institutions
In this food science activity, learners conduct an experiment that demonstrates the importance of light to plants.
Science Cooks!
Source Institutions
In this health, cooking, and math activity, learners explore nutrition and examine nutrition labels.
Solar System in My Neighborhood
Source Institutions
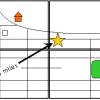
In this activity, learners shrink the scale of the vast solar system to the size of their neighborhood.
Number Sense and Computation: To Half or Half Not
Source Institutions
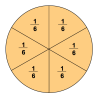
In this math lesson, learners use slices of bread and geoboards to explore several ways to divide a rectangle in half. Learners also identify equivalent fractions that represent one-half.
Joe's Place
Source Institutions
In this math activity (Page 8 of the Dining Out! PDF), younger learners select items from a menu and count out the total amount needed using the fewest bills and coins possible.
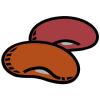
Not Just A Bag Of Beans
Source Institutions
In this activity, learners count and measure kidney beans to explore natural selection and variation. Learners measure the length of 50-100 beans.

Mix It Up
Source Institutions
In this math lesson, learners are introduced to proportional reasoning through modeling, sharing, and questioning techniques.
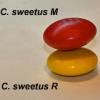
Survival of the Fittest: Variations in the Clam Species Clamys sweetus
Source Institutions
This guided inquiry three-part activity engages learners in thinking about the mechanism of natural selection by encouraging them to formulate questions that can be answered through scientific investi
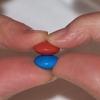
Survival of the Fittest: Battling Beetles
Source Institutions
This guided inquiry three-part activity engages learners in thinking about the mechanism of natural selection through data collection and pattern recognition.
Our Chemical Senses: Olfaction
Source Institutions
In this activity, learners investigate the olfactory system by conducting several experiments.