Search Results
Showing results 1 to 9 of 9
Pour Some: Measure Serving Size
Source Institutions
Make snack time into measuring time and learn to read Nutrition Facts labels. Try this when you’re using “pourable” foods, such as cereal, yoghurt, or juice.
Many Seeds: Estimating Hidden Seeds
Source Institutions
In this activity, learners will estimate how many seeds are in a fruit or vegetable, then count to find out. The result: mix estimation with healthy eating.
Starburst® Graph
Source Institutions
In this activity, learners use Starburst® candy to sort, classify, compare, and graph. Learners grab a handful of one-inch candy squares, sort them by color, graph the candy, and discuss the results.

What's the Difference between Weather and Climate?
Source Institutions
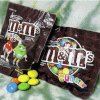
In this interactive and informative group activity, learners use packages of M&M's to illustrate the difference between weather and climate.

Bake Sale
Source Institutions
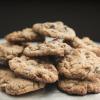
This activity helps learners learn about math through a real-world scenario. Three friends are baking cookies for their school’s bake sale.

Frijolitos
Source Institutions
Esta actividad enseña la proporción y razón por hacer que los aprendices hagan "ensaladas" que combinan tres tipos de frijoles en tres combinaciones diferentes.

Exponential Models: Rhinos and M&M’s ®
Source Institutions
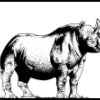
In this math lesson, learners model exponential decay and exponential growth using M&M's, paper folding, and African rhino population data.

Multi-Variable Relations: Stressed to the Breaking Point
Source Institutions
In this math lesson, learners explore the relationship between the thickness of a spaghetti bridge, the length of the bridge, and the amount of weight that can be supported by the bridge.

Statistics: Something Fishy
Source Institutions
In this math lesson, learners apply the concepts of ratio and proportion to the capture-recapture statistical procedure.
