Search Results
Showing results 41 to 59 of 59

Exponential Models: Rhinos and M&M’s ®
Source Institutions
In this math lesson, learners model exponential decay and exponential growth using M&M's, paper folding, and African rhino population data.
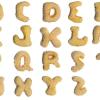
Computation and Estimation: Alphabits
Source Institutions
In this math lesson, learners apply the concepts of ratios and percentages to the distribution of letters contained in a box of Alphabits® cereal.

Statistics: Steppin' Out
Source Institutions
In this math lesson, learners construct box-and-whisker plots to analyze and compare data sets. Learners investigate whether or not long-legged people run faster than short-legged people.
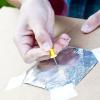
Measure the Sun's Size
Source Institutions
In this activity, learners make their own pinhole viewer in order to measure the size of the sun.

Up, Up, and Away
Source Institutions
In this math lesson, learners explore the real world meaning of slope. Learners conduct a balloon experiment in which they measure the circumference and flight time of deflating balloons.
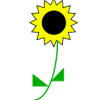
Patterns and Relationships: Peddling Petals
Source Institutions
In this math lesson, learners use the setting of a flower-making fundraiser to explore a variety of patterns. Learners examine the patterns in a flower design made of triangles surrounding a square.
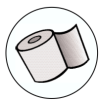
Toilet Paper Solar System
Source Institutions
In this activity, learners build a scale model of the solar system using a roll of toilet paper.
Light on Other Planets
Source Institutions
In this math-based activity, learners model the intensity of light at various distances from a light source, and understand how astronomers measure the amount of sunlight that hits our planet and othe
When Pigs Fly
Source Institutions
In this math lesson, learners explore probability.
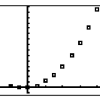
Quadratic Functions: Toothpicks and Transformations
Source Institutions
In this math lesson, learners explore transformations and quadratic functions through toothpick patterns.
Statistics: Creature Features
Source Institutions
In this math activity, learners collect, organize, and analyze a set of data related to types of animals in the temperate forest.
Probability: Rock Around The Clock
Source Institutions
In this math lesson, learners apply the Monte Carlo method of simulation to determine a reasonable estimate.
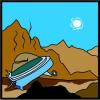
Chances Are: OH NO! Look Out Below for a UFO
Source Institutions
In this math lesson (on Page 13), learners predict and simulate the likelihood of an event occurring.
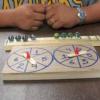
Games of Chance and Brains
Source Institutions
In this activity, learners build and play three math games. In the first game, called "Switcheroo," learners place marbles in holes 1 through 4 and 7 through 10.
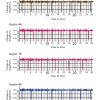
Transit Tracks
Source Institutions
In this space science activity, learners explore transits and the conditions when a transit may be seen.
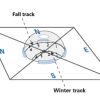
Reason for the Seasons
Source Institutions
In this activity (on page 6 of the PDF), learners plot the path of the sun's apparent movement across the sky on two days, with the second day occurring two or three months after the first.
An Interdisciplinary Deer and Human Population Study
Source Institutions
This activity helps the learner answer the question: "What environmental problems arise due to animal and human overpopulation and what might need to be done to combat these problems?" Learners play a
Patterns and Relationships: Struts 'n Stuff
Source Institutions
In this math lesson, learners identify the relationship between the number of sides in a regular polygon and the number of struts needed to make each polygon rigid.
Algebra: Aw Chute!
Source Institutions
In this math lesson, learners determine and compare the rate of descent of various learner-constructed parachutes. Learners construct parachutes that will have maximum hang times.