Search Results
Showing results 1 to 20 of 26
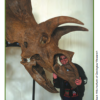
Supersize That Dinosaur
Source Institutions
In this activity, learners explore the size and scale of dinosaurs. Learners listen to "The Littlest Dinosaurs" by Bernard Most. Then, learners estimate the size of a Triceratops and T.
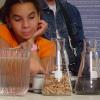
Size, Scale and Models
Source Institutions
In this activity, learners take measurements and create charts to learn about the size of dinosaurs and their relative scale to humans.
Sea State: Forecast Conditions at Sea
Source Institutions
In this oceanography and data collection activity, learners cast real time sea state conditions using buoys from NOAA's National Data Buoy Center.
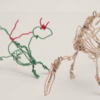
Compare Dinosaur Body Parts
Source Institutions
In this activity, learners explore the size and scale of dinosaurs. Learners listen to "The Littlest Dinosaurs" by Bernard Most to learn about the different sizes of dinosaurs.
Atmosphere Composition Model
Source Institutions
In this activity, learners create a model using metric measuring tapes and atmosphere composition data.

Dripping Wet or Dry as a Bone?
Learners investigate the concept of humidity by using a dry and wet sponge as a model. They determine a model for 100% humidity, a sponge saturated with water.

Good News: We're on the Rise!
Learners build a simple aneroid barometer to learn about changes in barometric pressure and weather forecasting. They observe their barometer and record data over a period of days.

How Big Were the Dinosaurs?
Source Institutions
In this activity (located on page 4 of PDF), learners gain insight into the actual size of dinosaurs and practice making estimations and measurements.
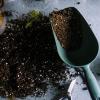
Super Soaking Materials
Source Institutions
In this activity, learners will test cups full of potting soil, sand, and sphagnum moss to see which earth material is able to soak up the most water.
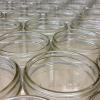
Hot Stuff!: Investigation #4
Learners test two jars containing soil, one covered and one open, for changes in temperature. After placing the jars in the Sun, learners discover that the covered jar cools down more slowly.
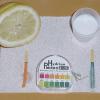
Acid (and Base) Rainbows
Learners use red cabbage juice and pH indicator paper to test the acidity and basicity of household materials. The activity links this concept of acids and bases to acid rain and other pollutants.

Acid Rain Effects
Learners conduct a simple experiment to model and explore the harmful effects of acid rain (vinegar) on living (green leaf and eggshell) and non-living (paper clip) objects.
The Earth's Timeline
Source Institutions
In this group activity, learners will mark important developments of life on Earth on a timeline (each foot in length representing 200 million years).

Hot Stuff!: Investigation #2
Learners test two jars containing hot water, one covered with plastic and one open, for changes in temperature.
Looking Back Through Time
Source Institutions
In this activity, learners create their own archaeological profiles.
Hot Stuff!: Investigation #3
Learners test two jars of ice water, one covered and one open, for changes in temperature. After placing the jars in the sun, learners discover that the covered jar cools down more slowly.

Hot Stuff!: Investigation #1
Learners test two jars, one containing plain air and one containing carbon dioxide gas, to see their reactions to temperature changes.

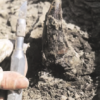
Do Your Own Dig
Source Institutions
In this outdoor archaeology activity, learners use mathematical skills and scientific inquiry to generate and process information from their own excavation site.
Can Nutrients in Water Cause Harm?
Source Institutions
In this water pollution activity, learners create pond water cultures and investigate the effects of adding chemicals or natural nutrients.
Super Soaker
Source Institutions
In this activity (page 1 of the PDF under SciGirls Activity: Bogs), learners will test cups full of potting soil, sand, and sphagnum moss to see which earth material is able to soak up the most water.