Search Results
Showing results 141 to 160 of 171
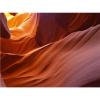
Erosion
Source Institutions
In this activity, learners model erosion using a clear shoebox and sand or soil.
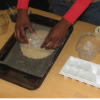
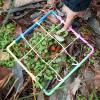
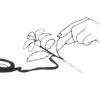
River Catcher
Source Institutions
In this activity (located at the top of the page), learners make an easy river strainer and see what they can catch.
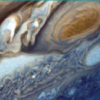
Weather Stations: Storms
Source Institutions
In this activity, learners test how cornstarch and glitter in water move when disturbed. Learners compare their observations with videos of Jupiter's and Earth's storm movements.
Ice on Mars
Source Institutions
In this activity, learners use sand and ice cubes to create a model of permafrost and the effects of the ice melting through the surface.
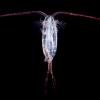
Plankton Feeding
Source Institutions
This activity provides a hands-on experience with a scale model, a relatively high viscosity fluid, and feeding behaviors.
Counting With Quadrants
Source Institutions
Millions of organisms can live in and around a body of water.

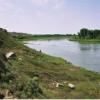
Floodplain Modeling
In this design-based lesson, learners study flood dynamics as they modify a riverbed with blockages or levees to simulate real-world scenarios.
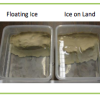
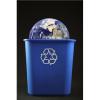
Sea Level: On The Rise
Source Institutions
Learners will understand the relationship between climate change and sea-level rise.
Mystery of the Disappearing Cottonwoods
Source Institutions
Learners will explore the scientific mystery behind a disappearing group of trees by examining data and attempting to explain the decline.
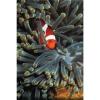
Underwater Hide and Seek
Source Institutions
In this activity, learners experience firsthand how marine animals' adaptive coloration camouflages them from prey.
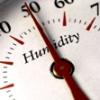
Making Sense of Sensors
Source Institutions
In this activity, learners explore sensors and focus specifically on how to measure humidity using a sensor.

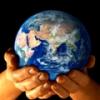
It's a Gas, Man
Source Institutions
In this activity, learners discover if carbon dioxide has an effect on temperature.

Monitoring Amphibians
Source Institutions
In this field study, learners discover how to collect data in the field and how their efforts can help certain animals, specifically, amphibians.
The Blue Crab's Chesapeake Journey
Source Institutions
In this data collection activity about crabs, learners use data from the Virginia Institute of Marine Science (VIMS) trawl survey to determine the areas of the Chesapeake Bay that are being used by bl

Avogadro's Bubbly Adventure
Source Institutions
In this activity on page 7 of the PDF, learners investigate the solubility of gas in water at different temperatures. This experiment will help learners determine if temperature affects solubility.

Sustainable Grazing
Source Institutions
In this activity, learners investigate the food, water, and space needs of common livestock animals.
Environmental Chemistry
Source Institutions
In this activity with several mini experiments, learners explore the chemistry that helps scientists learn about the environment and how they can help save it.
Oil Spill Solutions
Source Institutions
In this activity, learners explore how environmental engineers might approach solving the problem of an oil spill.
Fish Eyes: More than Meets the Eye
Source Institutions
In this data collection and analysis activity, learners evaluate fish physiology and ecology using vision research data from Dr.
Invent a Plant
Source Institutions
In this activity, learners construct models of plants that are adapted to living under specific environmental conditions.