Search Results
Showing results 81 to 100 of 101
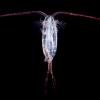
Plankton Feeding
Source Institutions
This activity provides a hands-on experience with a scale model, a relatively high viscosity fluid, and feeding behaviors.
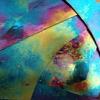
Iridescent Art
Source Institutions
This is a quick activity (on page 2 of the PDF under Butterfly Wings Activity) that illustrates how nanoscale structures, so small they're practically invisible, can produce visible/colorful effects.
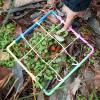
Counting With Quadrants
Source Institutions
Millions of organisms can live in and around a body of water.

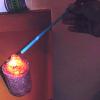
Hot Stuff!: Investigation #2
Learners test two jars containing hot water, one covered with plastic and one open, for changes in temperature.
Hot Stuff!: Investigation #3
Learners test two jars of ice water, one covered and one open, for changes in temperature. After placing the jars in the sun, learners discover that the covered jar cools down more slowly.
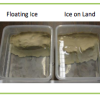
Sea Level: On The Rise
Source Institutions
Learners will understand the relationship between climate change and sea-level rise.
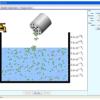
Salts & Solubility
Source Institutions
In this online interactive simulation, learners will add different salts to water and then watch the salts dissolve and achieve a dynamic equilibrium with solid precipitate.

pH Scale
Source Institutions
In this online interactive simulation, learners will test the pH of liquids like coffee, spit, and soap to determine whether each is acidic, basic, or neutral.
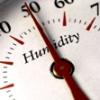
Making Sense of Sensors
Source Institutions
In this activity, learners explore sensors and focus specifically on how to measure humidity using a sensor.

It's a Gas, Man
Source Institutions
In this activity, learners discover if carbon dioxide has an effect on temperature.
Keep it Cool
Source Institutions
In this activity, learners explore how engineers have met the challenge of keeping foods, liquids, and other items cool.
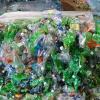
Reusable Rockets
Source Institutions
This activity (located on page 3 of the PDF under GPS: Garbology Activity) is a full inquiry investigation into design optimization using recycled materials.
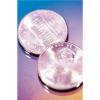
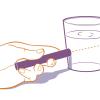
Statistics: Wet Heads
Source Institutions
In this math lesson, learners learn how to construct stem and leaf plots. Learners first estimate the number of drops of water that will fit on the head of a penny.

Monitoring Amphibians
Source Institutions
In this field study, learners discover how to collect data in the field and how their efforts can help certain animals, specifically, amphibians.

Avogadro's Bubbly Adventure
Source Institutions
In this activity on page 7 of the PDF, learners investigate the solubility of gas in water at different temperatures. This experiment will help learners determine if temperature affects solubility.
Beam Me Up!
Source Institutions
This is a quick activity (on page 2 of the PDF under Stained Glass Activity) about the "Tyndall effect," the scattering of visible light when it hits very small dispersed particles.
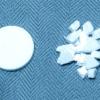
Fizzy Nano Challenge
Source Institutions
This lesson focuses on how materials behave differently as their surface area increases.
Chances Are: OH NO! Look Out Below for a UFO
Source Institutions
In this math lesson (on Page 13), learners predict and simulate the likelihood of an event occurring.
Fish Eyes: More than Meets the Eye
Source Institutions
In this data collection and analysis activity, learners evaluate fish physiology and ecology using vision research data from Dr.

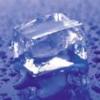
Arctic Sea Ice
Source Institutions
In this activity, learners explore how the area of Arctic sea ice has changed over recent years. First, learners graph the area of Arctic sea ice over time from 1979 to 2007.