Search Results
Showing results 1 to 15 of 15

Heat Capacity: Can't Take the Heat?
Source Institutions
Why is ocean water sometimes the warmest when the average daily air temperature starts to drop? In this activity, learners explore the differing heat capacities of water and air using real data.
Earth's Water: A Drop in Your Cup
Source Institutions
This creative lesson plan provides a visual way for learners to gain knowledge about the finite amount of fresh water on Earth and encourages the discussion of the various ways to conserve this resour
Earth's Water: A Drop in Your Cup
Source Institutions
This creative lesson plan provides a visual way for learners to gain knowledge about the finite amount of fresh water on Earth and encourages the discussion of the various ways to conserve this resour
Determining the Amount of Transpiration from a Schoolyard Tree
Source Institutions
In this activity, learners calculate the number of milliliters of water a nearby tree transpires per day.
Super Soaking Materials
Source Institutions
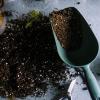
In this activity, learners will test cups full of potting soil, sand, and sphagnum moss to see which earth material is able to soak up the most water.
Super Soaker
Source Institutions
In this activity (page 1 of the PDF under SciGirls Activity: Bogs), learners will test cups full of potting soil, sand, and sphagnum moss to see which earth material is able to soak up the most water.

The Dead Zone: A Marine Horror Story
Source Institutions
In this environmental science and data analysis activity, learners work in groups to track a Dead Zone (decreased dissolved oxygen content of a body of water) using water quality data from the Nutrien

Earth Atmosphere Composition
Source Institutions
In this activity, learners use rice grains to model the composition of the atmosphere of the Earth today and in 1880. Learners assemble the model while measuring percentages.
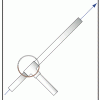
Launch Altitude Tracker
Source Institutions
In this activity, learners construct hand-held altitude trackers. The device is a sighting tube with a marked water level that permits measurement of the inclination of the tube.
Lungometer
Source Institutions
In this environmental health activity, learners investigate their own vital lung capacities.
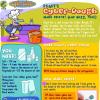
Digit's Cyber-Dough
Source Institutions
In this fun hands-on activity, learners whip up a batch of cyber-dough (play dough) using math for measurements.
Reusable Rockets
Source Institutions
This activity (located on page 3 of the PDF under GPS: Garbology Activity) is a full inquiry investigation into design optimization using recycled materials.
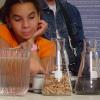
Number Sense and Computation: Soak It Up
Source Institutions
In this math lesson, learners compare products to determine the best product.

Sustainable Grazing
Source Institutions
In this activity, learners investigate the food, water, and space needs of common livestock animals.

Arctic Sea Ice
Source Institutions
In this activity, learners explore how the area of Arctic sea ice has changed over recent years. First, learners graph the area of Arctic sea ice over time from 1979 to 2007.