Search Results
Showing results 101 to 120 of 120

Monitoring Amphibians
Source Institutions
In this field study, learners discover how to collect data in the field and how their efforts can help certain animals, specifically, amphibians.
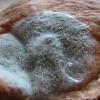
Moldy Jell-O
Source Institutions
In this laboratory activity, learners design an experiment to evaluate how environmental factors influence the growth of molds.
The Blue Crab's Chesapeake Journey
Source Institutions
In this data collection activity about crabs, learners use data from the Virginia Institute of Marine Science (VIMS) trawl survey to determine the areas of the Chesapeake Bay that are being used by bl
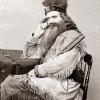
Mountain Man Measurement Rendezvous
Source Institutions
In this math lesson, learners participate in several activities where they apply measurement skills.
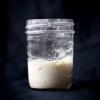
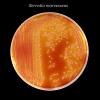
Wild Sourdough
Source Institutions
In this activity, learners explore chemistry and the microbial world by making their own sourdough starter and bread at home using only flour and water.
Trees: Buds and Twigs
Source Institutions
In this hands-on nature activity, learners observe the emergence of leaves and flowers. Branches from trees and bushes are collected in the early spring, brought indoors, and placed in water.

Sustainable Grazing
Source Institutions
In this activity, learners investigate the food, water, and space needs of common livestock animals.
Chromatography Can Separate!
Source Institutions
In this chemistry activity, learners use thin layer chromatography to determine the molecular composition of different markers.
Chances Are: OH NO! Look Out Below for a UFO
Source Institutions
In this math lesson (on Page 13), learners predict and simulate the likelihood of an event occurring.
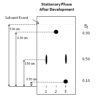
Measurement: It Takes Ten
Source Institutions
In this math lesson, learners practice estimation and measurement skills as they move from station to station calculating length, volume, weight, and area.
Fish Eyes: More than Meets the Eye
Source Institutions
In this data collection and analysis activity, learners evaluate fish physiology and ecology using vision research data from Dr.

Arctic Sea Ice
Source Institutions
In this activity, learners explore how the area of Arctic sea ice has changed over recent years. First, learners graph the area of Arctic sea ice over time from 1979 to 2007.
Demonstrating An Epidemic
Source Institutions
This experiment allows learners to experience a small scale "epidemic," demonstrating the ease with which disease organisms are spread, and enables learners to determine the originator of the "epidemi

Mapping Sea Level Rise
Source Institutions
In this activity related to climate change, learners create and explore topographical maps as a means of studying sea level rise.
Biochemistry Happens Inside of You!
Source Institutions
In this four-part activity, learners explore how the body works and the chemistry that happens inside living things.
Waves and Tides
Source Institutions
In this 7-10 day investigation, learners develop an understanding of waves and tides and their motion through discussion, demonstration, and hands-on activities.
Seas in Motion
Source Institutions
In this outdoor, beach activity, learners use tennis balls, water balloons and other simple devices to investigate the movement of waves and currents off a sandy beach.
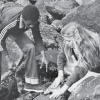
Rock Pioneers
Source Institutions
In this outdoor activity/field trip, learners investigate organisms that live along the ocean's rocky coast.
Going for a Spin: Making a Model Steam Turbine
Source Institutions
In this activity, learners explore how various energy sources can be used to cause a turbine to rotate.
Cooling Off
Source Institutions
In this activity, learners are introduced to challenges of maintaining temperatures while living in space.