Search Results
Showing results 1 to 20 of 27
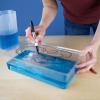
Clean Water: Is It Drinkable?
Source Institutions
In this activity, learners simulate nature's water filtration system by devising a system that will filter out both visible and invisible pollutants from water.
Storm Water Runoff Pollution
Source Institutions
This activity (located on page 8 of the PDF) introduces learners to the concept of Non-point Source Pollution--what happens when rain washes garbage and other pollutants into rivers and lakes.

Heat Capacity: Can't Take the Heat?
Source Institutions
Why is ocean water sometimes the warmest when the average daily air temperature starts to drop? In this activity, learners explore the differing heat capacities of water and air using real data.
Conductivity: Salty Water
Source Institutions
Water, whether fresh or salty, serves as one of the best electrical conductors on the planet. Does salt effect its conductivity?
Differing Densities: Fresh and Salt Water
Source Institutions
In this activity, learners visualize the differences in water density and relate this to the potential consequences of increased glacial melting.
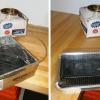
Solar Water Heater
Learners work in teams to design and build solar water heating devices that mimic those used in residences to capture energy in the form of solar radiation and convert it to thermal energy.
Causes and Effects of Melting Ice
Source Institutions
In this activity, learners explore the concept of density-driven currents (thermohaline circulation) and how these currents are affected by climate change.

What Causes Wind?
Source Institutions
In this sunny day experiment, learners measure and compare how quickly light and dark colored materials absorb heat.
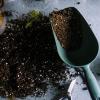
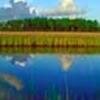
Super Soaker
Source Institutions
In this activity (page 1 of the PDF under SciGirls Activity: Bogs), learners will test cups full of potting soil, sand, and sphagnum moss to see which earth material is able to soak up the most water.
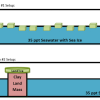
Global Climate Change and Sea Level Rise
Source Institutions
In this activity, learners practice the steps involved in a scientific investigation while learning why ice formations on land (not those on water) will cause a rise in sea level upon melting.

Measure the Pressure: The "Wet" Barometer
Source Institutions
In this activity, learners use simple items to construct a device for indicating air pressure changes.
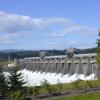
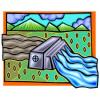
The Best Dam Simulation Ever
Source Institutions
This online simulation game explores the different consequences of water levels on the Columbia River in the Pacific Northwest.
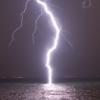
Without An Ark: The Effects of Storms and Floods
Source Institutions
April showers bring May flowers, but what do coastal storms bring?
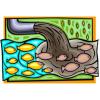
Human Impact on Estuaries: A Terrible Spill in Grand Bay
Source Institutions
In this activity, learners make a model of a pollution spill that occurred at Bangs Lake in Mississippi and measure water quality parameters in their model.

The Dead Zone: A Marine Horror Story
Source Institutions
In this environmental science and data analysis activity, learners work in groups to track a Dead Zone (decreased dissolved oxygen content of a body of water) using water quality data from the Nutrien
Exploring Earth: Rising Sea
Source Institutions
“Exploring Earth: Rising Sea” is a hands-on activity demonstrating ways to use topographical mapping techniques to track changes in sea level. The activity is connected to current NASA research.

Earth Atmosphere Composition
Source Institutions
In this activity, learners use rice grains to model the composition of the atmosphere of the Earth today and in 1880. Learners assemble the model while measuring percentages.
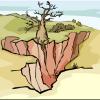
A Hole in the Ground
Source Institutions
Learners build models of sinkholes to gain an intuitive knowledge of their physical aspects.
Launch Altitude Tracker
Source Institutions
In this activity, learners construct hand-held altitude trackers. The device is a sighting tube with a marked water level that permits measurement of the inclination of the tube.
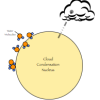
Do Cities Affect the Weather?
Source Institutions
In this activity, learners explore clouds and how they form.