Search Results
Showing results 1 to 20 of 22

Drawing Conclusions
Source Institutions
In this weather forecasting activity, learners determine the location of cold and warm fronts on weather plot maps.
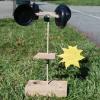
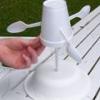
Weather Vane and Anemometer
Source Institutions
In this meteorology activity, learners construct simple devices to measure the direction and speed of wind.
Make Your Own Barometer
Source Institutions
In this weather activity (page 10 of the PDF), learners will demonstrate the changes in atmospheric pressure by constructing their own barometer.

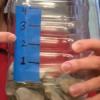
Measure the Pressure: The "Wet" Barometer
Source Institutions
In this activity, learners use simple items to construct a device for indicating air pressure changes.

Measure the Pressure II: The "Dry" Barometer
Source Institutions
In this activity, learners use simple items to construct a device for indicating air pressure changes.
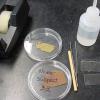
The Crayon Rock Cycle
Source Institutions
In this activity, learners use crayons to draw conclusions about rocks and the rock cycle.
AM in the PM
Source Institutions
In this activity, learners will listen to as many radio stations as possible to discover that AM radio signals can travel many hundreds of miles at night.
Homemade Rain Gauge
Source Institutions
In this activity, learners will build rainwater collectors to practice meteorology in their own backyard. Collect and analyze data to determine how much rainfall you get in a set period of time.
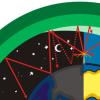
Running in Circles
Source Institutions
In this group activity, learners use some common objects and work together to simulate the Coriolis effect. During the challenge, learners make predictions and test different scenarios.
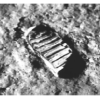
Regolith Formation
Source Institutions
In this three-part activity, learners use food to determine the effects of wind, sandblasting and water on regolith (dust) formation and deposition on Earth.

A Hurricane's Storm Surge Affects our Estuaries
Source Institutions
In this activity, learners construct a coastal landmass from sand and add features such as tidal creeks and barrier islands.
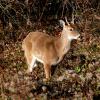
Population Study Game: Oh, Deer!
Source Institutions
In this activity, learners model a population of deer and see how the number of deer changes over time.
Sand Activity
Source Institutions
In this activity, learners observe mixtures of sand samples glued to note cards, and consider how sand can differ in size, shape, and color, and where it comes from.

Quadraphonic Wind
Source Institutions
In this activity, learners discover how the extent of various wind speeds changes in each of the four quadrants around a hurricane.
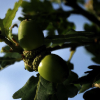
Seed Adaptations
Source Institutions
By participating in a seed scavenger hunt, learners examine many adaptations of seeds, including how many seeds a plant makes, how those seeds travel to new locations, and what protects them from pred
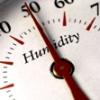
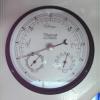
Making Sense of Sensors
Source Institutions
In this activity, learners explore sensors and focus specifically on how to measure humidity using a sensor.
The Carbon Cycle: How It Works
Source Institutions
In this game, learners walk through an imaginary Carbon Cycle and explore the ways in which carbon is stored in reservoirs and the processes that transport the carbon atom from one location to another
The Return of El Nino
Source Institutions
In this activity related to climate change and data analysis, learners examine temperature and precipitation data to determine if climate variations are due to El Niño.
Measuring the Wind
Source Institutions
In this activity, learners explore how anemometers work to record wind speeds and how the equipment has undergone engineering adaptations over time.
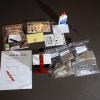
Crime Scene Investigation (CSI) with Powdery Mildew Fungi
Source Institutions
This exercise can be used to stimulate the investigative nature of learners as they use forensic plant pathology techniques to prove the learners' innocence in a mock murder investigation.