Search Results
Showing results 101 to 120 of 156
West Coast Shipwrecks
Source Institutions
In this data activity, learners will explore shipwrecks from four National Marine Sanctuaries on the West Coast of the United States.
Life Size: Line 'em up!
Source Institutions
In this activity on page 1 of the PDF, learners compare the relative sizes of biological objects (like DNA and bacteria) that can't be seen by the naked eye.
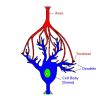
Neuron Chain Tag
Source Institutions
In this outdoor activity, learners play a game of Tag to discover how neurons attach themselves to each other to form a chain.
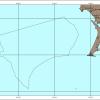
The Ins and Outs of Tides: Learn About Causes and Predictions
Source Institutions
In this activity, learners will compare predicted and observed tides using data from The National Oceanic and Atmospheric Administration(NOAA).
Tsunami: Waves of Destruction
Source Institutions
In this activity, learners use tsunami time travel maps to predict how long it will take a tsunami to reach the shore.
Two Sets!
Source Institutions
In this card game, learners make two sets of three cards that are alike. Learners must justify to the rest of the players why the three cards belong in each set.
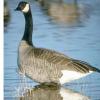
Canada Goose: Explore Trends With Data
Source Institutions
In this activity, learners will explore trends in Canada goose populations using real data from the National Audubon Society's Christmas Bird Count.

Guess My Rule
Source Institutions
In this math activity, learners play a game and try to be the first player to identify their partner's rule. Learners identify the rule by finding commonalities between three familiar objects.
The Carbon Cycle: Carbon Tracker
Source Institutions
In this activity, learners play NOAA's Carbon Tracker game and discover ways to keep track of carbon dioxide and other greenhouse gases in the world.
The Checks Lab
Source Institutions
A group of learners has an envelope containing a series of bank checks. A few checks are removed at a time, and the team attempts to construct a plausible scenario which involves those checks.
Heavy or Light
Source Institutions
In this activity, learners explore a scale by comparing objects, which look similar but have different weights. Learners predict and then measure the weights of various objects using a scale.
Harmful Algal Blooms: In Full Bloom
Source Institutions
In this activity, learners will investigate the impacts of harmful phytoplankton using NOAA's Coastal Services Center Harmful Algal Bloom Forecasting (HABF) Project data.
Atmospheric Collisions
Source Institutions
In this activity/demonstration, learners observe what happens when two ping pong balls are suspended in the air by a hair dryer. Use this activity to demonstrate how rain drops grow by coalescence.

The Shadow Knows I
Source Institutions
In this activity, learners will measure the length of their shadow from the Sun and compare it three to four months later.

Drawing Conclusions
Source Institutions
In this weather forecasting activity, learners determine the location of cold and warm fronts on weather plot maps.
Make a Human Scale Ladder
Source Institutions
In this quick activity about size and scale (on page 2 of the PDF under What's Nano?

Olympic Track Meet
Source Institutions
In this activity, learners discover how exercise helps keep the body healthy. Learners increase their heart rates by running and understand how running fast versus walking affects their pulse rates.
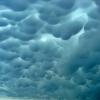
Head in the Clouds
Source Institutions
In this activity, learners create a CloudSpotter wheel and record the different types of clouds they observe twice daily over several days.
Greeting Card Boxes
Source Institutions
In this activity, learners make cool boxes out of old (or new) greeting cards or postcards.
Exercise in Creating Drawings for Field Notebooks
Source Institutions
Learners draw and describe a leaf, and then re-find leaves drawn and described by other learners. Learners can observe leaves outside, or leaves may be brought into the classroom.