Search Results
Showing results 21 to 40 of 43
Differing Densities: Fresh and Salt Water
Source Institutions
In this activity, learners visualize the differences in water density and relate this to the potential consequences of increased glacial melting.
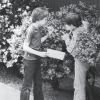
Plants Around a Building
Source Institutions
In this outdoor activity, learners discover how the environment around a building affects the growth of plants.

Chocolate (Sea Floor) Lava
Source Institutions
In this edible experiment, learners pour "Magic Shell" chocolate into a glass of cold water. They'll observe as pillow shaped structures form, which resemble lavas on the sea floor.
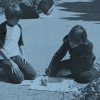
Plant Patterns
Source Institutions
In this outdoor mapping activity, learners explore where plants grow and map plant-distribution patterns.
How does the Atmosphere keep the Earth Warmer?
Source Institutions
In this activity, learners simulate the energy transfer between the earth and space by using the light from a desk lamp desk lamp with an incandescent bulb and a stack of glass plates.

The Daily Ups and Downs
Source Institutions
In this activity, learners graph 48 hourly air temperatures from a local weather observation site and observe the diurnal temperature variations.
House Warming
Source Institutions
In this physical sciences activity, learners explore how passive solar design increases energy efficiency.
What's the Angle?
Source Institutions
This activity helps learners understand how the angle of the Sun affects temperatures around the globe.

That Sinking Feeling
Source Institutions
In this quick activity, learners observe how salinity and temperature affect the density of water, to better understand the Great Ocean Conveyor.
Canned Heat
Source Institutions
In this activity, learners explore how light and dark colored objects absorb the Sun's radiations at different rates.
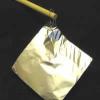
Make Your Own Deep-Sea Vent
Source Institutions
In this activity, learners make a model of the hot water of a deep sea vent in the cold water of the ocean to learn about one of the ocean's most amazing and bizarre underwater habitats.
Terrestrial Hi-Lo Hunt
Source Institutions
In this outdoor activity, learners search for the warmest and coolest, windiest and calmest, wettest and driest, and brightest and darkest spots in an area.
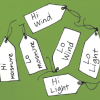
Sensory Hi-Lo Hunt
Source Institutions
In this outdoor activity, learners use only their senses to to find the extremes of several environmental variables or physical factors: wind, temperature, light, slope and moisture.

Drawing Conclusions
Source Institutions
In this weather forecasting activity, learners determine the location of cold and warm fronts on weather plot maps.

Forward Thinking
Source Institutions
In this activity, learners create their own weather forecast map.

Saguaro Nest Cavities
Source Institutions
This activity (on page 3 of the PDF under GPS: Cactus Activity) is a full inquiry investigation into how some desert birds keep their cool.
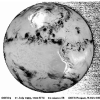
Weather Stations: Winds
Source Institutions
In this activity, learners use a toaster to generate wind and compare the appliance's heat source to Jupiter's own hot interior. Learners discover that convection drives wind on Jupiter and on Earth.
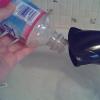
Air Pressure
Source Institutions
In this experiment, learners use a blow dryer and water bottle to observe and record changes in air pressure caused by changes in temperature.

Heat Capacity: Can't Take the Heat?
Source Institutions
Why is ocean water sometimes the warmest when the average daily air temperature starts to drop? In this activity, learners explore the differing heat capacities of water and air using real data.
What is a "Model"?
Source Institutions
In this activity, learners simulate the behavior of the atmosphere.