Search Results
Showing results 161 to 180 of 1068
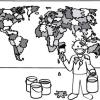
The Poor Cartographer: Graph Coloring
Source Institutions
In this activity, learners help a poor cartographer color in the countries on a map, making sure each country is colored a different color than any of its neighbors.
Ping Pong Ball Shooter
Source Institutions
In this activity, learners use ABS pipe and an air leaf blower to make a strong shooting machine.
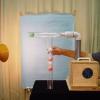
Pico Cricket Compass
Source Institutions
Learners can program a compass to draw a circle by itself using a Pico Cricket, some Legos, and lots of tape! Pico Cricket is required.
Life in a Nutshell
Source Institutions
In this multi-faceted game (on pages 25-35), learners recreate what happens to creatures in the Brazilian rain forest as they grow from egg to adult—especially those that use fallen, empty Brazil nut
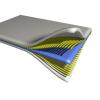
Stop the Stretching
Source Institutions
Learners work with plastic sheeting, masking tape, and string to design the perfect material for plastic chair webbing, and then construct their webbing.

Relative Speed of Dinosaurs
Source Institutions
In this activity, learners interpret three trackways and use measurements and a formula to infer the relative speed of dinosaurs.

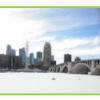
Rooftop Gardens
How does a green roof, or roof covered by plants, affect the temperature of the inside and outside of a building? Learners design and build houses to find out the answer.
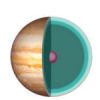
Jiggly Jupiter
Source Institutions
In this activity, learners build edible models of Jupiter and Earth to compare their sizes and illustrate the planets' internal layers.
Weather and Climate: What's the Difference?
Source Institutions
This lesson plan enables learners to explore the differences between weather and climate.
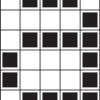
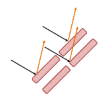
Color by Numbers: Image Representation
Source Institutions
Computers store drawings, photographs, and other pictures using only numbers. Through this activity, learners decode numbers to create pictures using the same process that computers use.
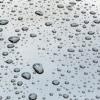
Liquid Crystals Interact with Light!
Source Institutions
In this two-part activity, learners explore the properties of liquid crystals, which are responsible for why mood rings change color.

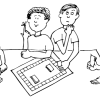
Frijolitos
Source Institutions
Esta actividad enseña la proporción y razón por hacer que los aprendices hagan "ensaladas" que combinan tres tipos de frijoles en tres combinaciones diferentes.
Atmospheric Collisions
Source Institutions
In this activity/demonstration, learners observe what happens when two ping pong balls are suspended in the air by a hair dryer. Use this activity to demonstrate how rain drops grow by coalescence.

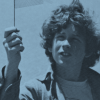
Wind Power: Creating a Wind Generator
Source Institutions
This lesson challenges groups of learners to design and construct a wind generator with the most electrical output.
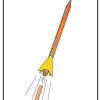
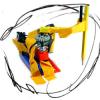
3...2...1 Puff!
Source Institutions
In this activity, learners build small indoor paper rockets, determine their flight stability, and launch them by blowing air through a drinking straw.
Terrestrial Hi-Lo Hunt
Source Institutions
In this outdoor activity, learners search for the warmest and coolest, windiest and calmest, wettest and driest, and brightest and darkest spots in an area.
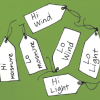
Sensory Hi-Lo Hunt
Source Institutions
In this outdoor activity, learners use only their senses to to find the extremes of several environmental variables or physical factors: wind, temperature, light, slope and moisture.
Planet Surfing
Source Institutions
In this astronomy activity (page 6 of the PDF), learners will compare and contrast two planets in the solar system using data obtained from the internet.
Cookie Surface Area
Source Institutions
This is an activity (on page 2 of the PDF under Surface Area Activity) about surface area to volume ratio.
Trees: Recorders of Climate Change
Source Institutions
In this activity, learners are introduced to tree rings by examining a cross section of a tree, also known as a “tree cookie.” They discover how tree age can be determined by studying the rings and ho