Search Results
Showing results 1 to 19 of 19

The Scoop on Scallops
Source Institutions
In this data analysis activity, learners quantify the abundance and distribution of sea scallops in and adjacent to the Mid-Atlantic closed areas.

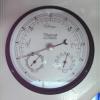
Measure the Pressure: The "Wet" Barometer
Source Institutions
In this activity, learners use simple items to construct a device for indicating air pressure changes.

Mapping Sea Level Rise
Source Institutions
In this activity related to climate change, learners create and explore topographical maps as a means of studying sea level rise.
Make a Terrarium
Source Institutions
In this activity, learners make a miniature greenhouse or "terrarium" to explore the greenhouse effect.

Chilean Sea Bass: Off the Menu
Source Institutions
In this data analysis activity, learners use data collected by the Commission for the Conservation of Antarctic Marine Living Resources (CCAMLR) to study Chilean sea bass populations.
Inverted Foucault Pendulum
Source Institutions
In this demonstration, learners explore a variation of a Foucault pendulum, but upside down.
To Topo Two
Source Institutions
In this activity, two groups of learners create two separate landform models out of clay (mountains and valleys).
Personal Time Line
Source Institutions
In this activity, learners work in groups to create a time line representing significant moments in their lives.
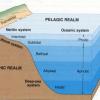
Introduction to Ocean Zones
Source Institutions
In this activity, learners will create a diagram of the ocean zones and determine what organisms live in each zone.
What's the Angle?
Source Institutions
This activity helps learners understand how the angle of the Sun affects temperatures around the globe.

Earth Atmosphere Composition
Source Institutions
In this activity, learners use rice grains to model the composition of the atmosphere of the Earth today and in 1880. Learners assemble the model while measuring percentages.
Fast Rusting
Source Institutions
In this activity, learners conduct an experiment to find out if steel wool will weigh more or less when it is burned. Learners will explore the effects of oxidation and rusting on the steel wool.
The Blue Crab's Chesapeake Journey
Source Institutions
In this data collection activity about crabs, learners use data from the Virginia Institute of Marine Science (VIMS) trawl survey to determine the areas of the Chesapeake Bay that are being used by bl

Measure the Pressure II: The "Dry" Barometer
Source Institutions
In this activity, learners use simple items to construct a device for indicating air pressure changes.
Make Your Own Barometer
Source Institutions
In this weather activity (page 10 of the PDF), learners will demonstrate the changes in atmospheric pressure by constructing their own barometer.
Atmosphere Composition Model
Source Institutions
In this activity, learners create a model using metric measuring tapes and atmosphere composition data.
Build the Big Dipper
Source Institutions
Learners use simple materials to construct a model the Big Dipper. Learners hang the model from a doorway or ceiling and look up at it to see the constellation as seen from Earth.
Without An Ark: The Effects of Storms and Floods
Source Institutions
April showers bring May flowers, but what do coastal storms bring?
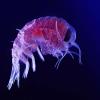
Amphipods: More than Mud
Source Institutions
In this data analysis and environmental science activity, learners examine the effects of pollution on amphipods using data from the Chesapeake Ecotox Research Program.