Search Results
Showing results 21 to 40 of 287
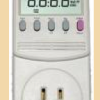
Plugged in to CO2
Source Institutions
In this activity, learners investigate various appliances and electronics, discovering how much energy each uses and how much carbon dioxide (CO2) is released to produce that energy.
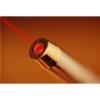
Delta, Delta, Delta
Source Institutions
In this experiment, learners construct an equilateral triangle using graph paper, a pencil, protractor and ruler. They also make a "laser triangle" using a laser pointer and front-silvered mirrors.
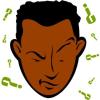
Now or Later: The "Recency/Primary" Effect
Source Institutions
In this activity (18th on the page), learners conduct an experiment to examine memory.
How Far?
To learn how friction affects motion, learners build a measurement tool from a rubber band and other simple materials.
Morphing Butterfly
Source Institutions
In this activity, learners explore how nanosized structures can create brilliant color.
Radioactive Decay of Candium
Source Institutions
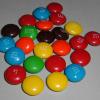
In this simulation, learners use M&M™ candy to explore radioactive isotope decay.
Linear Functions: Mystery Liquids
Source Institutions
In this math lesson, learners analyze the density of liquids in order to explore linear functions.
The Space Place
Source Institutions
In this activity (23rd on the page), learners conduct an experiment to examine memory and learning.
Gravity Fail
Source Institutions
In this activity, learners try pouring water out of a regular cup and a miniature cup. It’s harder than it sounds! Learners discover that different forces dominate at different size scales.
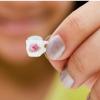
Gummy Shapes
Source Institutions
In this activity, learners use chemistry to “self-assemble” gummy shapes. Learners discover that self-assembly is a process by which molecules and cells form themselves into functional structures.
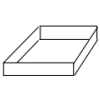
Polynomial and Rational Functions: Building Boxes
Source Institutions
In this math lesson, learners explore polynomial and rational function patterns.
Counting With Quadrants
Source Institutions
Millions of organisms can live in and around a body of water.
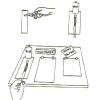
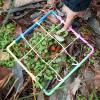
Catapult
Source Institutions
In this activity, learners construct their own small catapults using simple materials. Learners follow visual instructions to build their launching device.
Illuminations on Rates of Reactions
Source Institutions
In this activity, learners investigate the speed of chemical reactions with light sticks. Learners discover that reactions can be sped up or slowed down due to temperature changes.

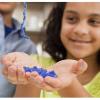
Secret Codon
Source Institutions
In this activity, "write" a secret message in genetic code as beads on a string.

A Cubic Foot Per Second
Source Institutions
In this activity, learners measure and calculate the amount of cubic feet various containers contain. Next, learners investigate cubic feet per second (cps), by carrying jugs in one second.

Whose Fault Is It?
Source Institutions
In this seismic simulation, learners play a "who-dunnit" game to explore earthquakes.
Graph Dance
Source Institutions
In this activity, learners "dance" (move back and forth at varying speeds) by reading a graph. This is a kinesthetic way to help learners interpret and understand how motion is graphed.

Arctic Sea Ice
Source Institutions
In this activity, learners explore how the area of Arctic sea ice has changed over recent years. First, learners graph the area of Arctic sea ice over time from 1979 to 2007.
Let's Count Humpback Whales: Environmental Effects on Population
Source Institutions
In this activity, learners use whale count data from the Hawaiian Islands Humpback Whale National Marine Sanctuary to compare whale counts in relation to environmental factors.