Search Results
Showing results 1 to 17 of 17
Composting Bioreactor
Source Institutions
In this activity (page 19 of the PDF) learners will create a soda bottle bioreactor by exploring the science of composting, comparing variables such as reactor design, moisture content, and nutrient r

A Recipe for Air
Learners use M&Ms® (or any other multi-color, equally-sized small candy or pieces) to create a pie graph that expresses the composition of air.
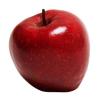
An Apple as Planet Earth
Source Institutions
In this environmental education demonstration (page 6 of the PDF), learners will see a tangible representation of the scarcity of soil resources on earth.

The Scoop on Scallops
Source Institutions
In this data analysis activity, learners quantify the abundance and distribution of sea scallops in and adjacent to the Mid-Atlantic closed areas.
Wrap It Up!
Source Institutions
In this Energy and Environment activity (page 9 of the PDF), learners calculate the mass of a piece of gum, compare it to the mass of the gum's packaging, and then create a bar graph of the results.
Amphibian Skin
Source Institutions
In this activity, learners explore the concept of permeability to better understand why amphibians are extremely sensitive to pollution.
Making Connections: What You Can Do To Help Stop Global Climate Change
Source Institutions
In this cooperative learning activity, learners visit ten stations and are challenged to think critically about various conservation questions and issues.

Mapping Sea Level Rise
Source Institutions
In this activity related to climate change, learners create and explore topographical maps as a means of studying sea level rise.

Chilean Sea Bass: Off the Menu
Source Institutions
In this data analysis activity, learners use data collected by the Commission for the Conservation of Antarctic Marine Living Resources (CCAMLR) to study Chilean sea bass populations.

Avogadro's Bubbly Adventure
Source Institutions
In this activity on page 7 of the PDF, learners investigate the solubility of gas in water at different temperatures. This experiment will help learners determine if temperature affects solubility.
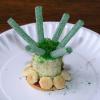
Build a Coral Polyp
Source Institutions
In this activity, learners build one or more edible coral polyps and place them together to form a colony.
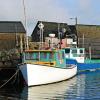
Sustainable Fishing
Source Institutions
In this activity, learners use a model for how fishing affects marine life populations, and will construct explanations for one of the reasons why fish populations are declining.
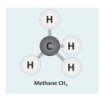
Let's Make Molecules
Source Institutions
In this activity, learners use gumdrops and toothpicks to model the composition and molecular structure of three greenhouse gases: carbon dioxide (CO2), water vapor (H2O) and methane (CH4).
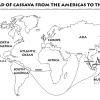
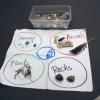
Green Travelers
Source Institutions
In this activity (on pages 23-29), partners use the Plant Traveler Cards, along with a world map and map worksheets, to follow plants such as cassava, chocolate and coffee that grew first in one part
I Can't Take the Pressure!
Learners develop an understanding of air pressure in two different activities.
Fungus Among Us
Source Institutions
In this environmental health activity, learners grow and observe bread mold and other kinds of common fungi over the course of 3-7 days.
Beach Buckets
Source Institutions
In this activity, learners explore a bucket of sand and beach objects.