Search Results
Showing results 1 to 20 of 59
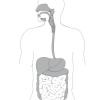
Digestion
Source Institutions
In this food science activity, learners explore digestion and proteins by observing the action of meat tenderizer on luncheon meat.

A Funny Taste
Source Institutions
In this activity, learners explore the different salinities of various sources of water by taste-testing.
Digit's Cyber-Dough
Source Institutions
In this fun hands-on activity, learners whip up a batch of cyber-dough (play dough) using math for measurements.
Measuring Rules
Source Institutions
In this math activity, learners create their own units of measurement by making noodle rulers. Learners practice estimating and measuring objects using the noodle rulers .

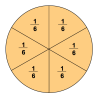
A Recipe for Air
Learners use M&Ms® (or any other multi-color, equally-sized small candy or pieces) to create a pie graph that expresses the composition of air.

Frijolitos
Source Institutions
Esta actividad enseña la proporción y razón por hacer que los aprendices hagan "ensaladas" que combinan tres tipos de frijoles en tres combinaciones diferentes.
Cookie Surface Area
Source Institutions
This is an activity (on page 2 of the PDF under Surface Area Activity) about surface area to volume ratio.

Exponential Models: Rhinos and M&M’s ®
Source Institutions
In this math lesson, learners model exponential decay and exponential growth using M&M's, paper folding, and African rhino population data.

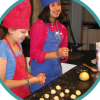
Bake Sale
Source Institutions
This activity helps learners learn about math through a real-world scenario. Three friends are baking cookies for their school’s bake sale.
Special Snack: Budgeting for Health
Source Institutions
In this activity, learners will plan a snack within a budget. With a $20 limit (theoretical) to spend on snack for everyone, learners look over grocery store circulars and make their shopping lists.
Number Sense and Computation: An Apple a Day
Source Institutions
In this math lesson, learners make estimates to analyze the number of apples per acre, and visualize the magnitude of one million.
Joe's Place
Source Institutions
In this math activity (Page 8 of the Dining Out! PDF), younger learners select items from a menu and count out the total amount needed using the fewest bills and coins possible.
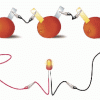
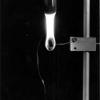
Electricity: Fruit Batteries
Source Institutions
In this activity, learners create a battery from fruit. This activity helps learners explore electricity, electrochemistry, and series circuits as well as the process of scientific inquiry.
Number Sense and Computation: To Half or Half Not
Source Institutions
In this math lesson, learners use slices of bread and geoboards to explore several ways to divide a rectangle in half. Learners also identify equivalent fractions that represent one-half.
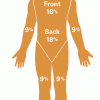
Measuring and Protecting Skin
Source Institutions
In this activity, learners compare and contrast their own skin (including the area covered) with that of an orange.
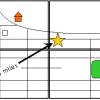
Solar System in My Neighborhood
Source Institutions
In this activity, learners shrink the scale of the vast solar system to the size of their neighborhood.
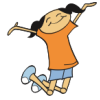
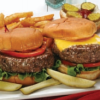
Work Up An Appetite
Source Institutions
In this activity, learners participate in fun movement activities while playing on a giant game board. Use this activity to get learners involved in physical activity.
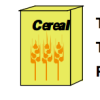
Number Sense and Computation: Food For Thought
Source Institutions
In this math lesson, learners identify and compare unit costs of given items. Learners use computation skills, problem solving and number sense to find the cost of an ounce of cereal.
Burn a Peanut
Source Institutions
In this activity, learners burn a peanut, which produces a flame that can be used to boil away water and count the calories contained in the peanut.
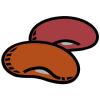
Not Just A Bag Of Beans
Source Institutions
In this activity, learners count and measure kidney beans to explore natural selection and variation. Learners measure the length of 50-100 beans.