Search Results
Showing results 1 to 20 of 39
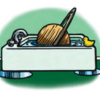
Measuring Rules
Source Institutions
In this math activity, learners create their own units of measurement by making noodle rulers. Learners practice estimating and measuring objects using the noodle rulers .
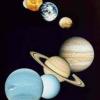
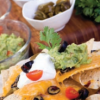
Dunking the Planets
Source Institutions
In this demonstration, learners compare the relative sizes and masses of scale models of the planets as represented by fruits and other foods.
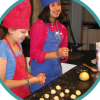
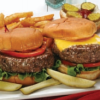
Breakfast Sweets
Source Institutions
In this math activity, learners guess which cereals contain the most sugar. Learners use the nutrition labels on the cereal boxes to find the cereal with the least amount of sugar.
Cookie Surface Area
Source Institutions
This is an activity (on page 2 of the PDF under Surface Area Activity) about surface area to volume ratio.

Exponential Models: Rhinos and M&M’s ®
Source Institutions
In this math lesson, learners model exponential decay and exponential growth using M&M's, paper folding, and African rhino population data.

Bake Sale
Source Institutions
This activity helps learners learn about math through a real-world scenario. Three friends are baking cookies for their school’s bake sale.
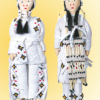
Plenty on the Plains
Source Institutions
In this activity, learners compare the ways of life of Plains Native Americans who hunted and moved frequently to follow the buffalo herds, and Native Americans who farmed and lived in more permanent
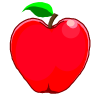
Number Sense and Computation: An Apple a Day
Source Institutions
In this math lesson, learners make estimates to analyze the number of apples per acre, and visualize the magnitude of one million.

Mapping Sea Level Rise
Source Institutions
In this activity related to climate change, learners create and explore topographical maps as a means of studying sea level rise.
Joe's Place
Source Institutions
In this math activity (Page 8 of the Dining Out! PDF), younger learners select items from a menu and count out the total amount needed using the fewest bills and coins possible.
The Thousand-Yard Model
Source Institutions
This is a classic exercise for visualizing the scale of the Solar System.
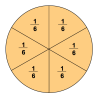
Number Sense and Computation: To Half or Half Not
Source Institutions
In this math lesson, learners use slices of bread and geoboards to explore several ways to divide a rectangle in half. Learners also identify equivalent fractions that represent one-half.
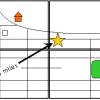
Solar System in My Neighborhood
Source Institutions
In this activity, learners shrink the scale of the vast solar system to the size of their neighborhood.

Multi-Variable Relations: Stressed to the Breaking Point
Source Institutions
In this math lesson, learners explore the relationship between the thickness of a spaghetti bridge, the length of the bridge, and the amount of weight that can be supported by the bridge.
Work Up An Appetite
Source Institutions
In this activity, learners participate in fun movement activities while playing on a giant game board. Use this activity to get learners involved in physical activity.

Create a Pasta Population Map
Source Institutions
Learners work as a group to create a map of their community. They use pasta to represent people, and glue the pasta on their maps to show areas of large population.

The Snack Shop
Source Institutions
In this math activity (Page 11 of the Dining Out! PDF), younger learners count out the total amount of money needed to purchase trail mix using the fewest number of bills/coins possible.
The Menu Game at the Terribly Terrific Taco
Source Institutions
In this math game (Page 15 of the Dining Out! PDF), learners figure discounts and/or profit increases for various food totals. Learners add decimals to $100.
Servings and Choices
Source Institutions
In this nutrition activity (page 16 of PDF), learners document their individual eating habits and learn whether their eating patterns meet their needs.
Do Plants Need Light?
Source Institutions
In this food science activity, learners conduct an experiment that demonstrates the importance of light to plants.