Search Results
Showing results 1 to 20 of 55

A Funny Taste
Source Institutions
In this activity, learners explore the different salinities of various sources of water by taste-testing.
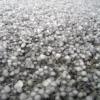
Sizing Up Hail
Source Institutions
In this activity, learners will estimate the sizes of balls to learn how to estimate the size of hail. Learners will compare their estimates to the estimates of their peers and the real measurements.

A Recipe for Air
Learners use M&Ms® (or any other multi-color, equally-sized small candy or pieces) to create a pie graph that expresses the composition of air.
Going for a Spin: Making a Model Steam Turbine
Source Institutions
In this activity, learners explore how various energy sources can be used to cause a turbine to rotate.

Twirling in the Breeze
Source Institutions
In this engineering activity, learners build a device (an anemometer) to measure how fast the wind is blowing.

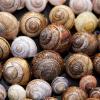
The Scoop on Scallops
Source Institutions
In this data analysis activity, learners quantify the abundance and distribution of sea scallops in and adjacent to the Mid-Atlantic closed areas.

Measure the Pressure: The "Wet" Barometer
Source Institutions
In this activity, learners use simple items to construct a device for indicating air pressure changes.
Measuring Biodiversity
Source Institutions
Learners use a variety of beans to represent a variety of species, and scatter these beans over a large piece of paper representing the environment.
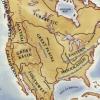
Woodlands Map
Source Institutions
This is a culminating activity which allows learners to summarize what they know about Woodlands Native Americans by creating illustrations and map symbols for a large outline map (see related Activit
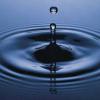
Earth's Water: A Drop in Your Cup
Source Institutions
This creative lesson plan provides a visual way for learners to gain knowledge about the finite amount of fresh water on Earth and encourages the discussion of the various ways to conserve this resour

Mapping Sea Level Rise
Source Institutions
In this activity related to climate change, learners create and explore topographical maps as a means of studying sea level rise.
Effects of Solar Radiation on Land and Sea
Source Institutions
In this activity, learners explore the different heating properties of soil and water.

A Degrading Experience
Source Institutions
In this activity on page 27, learners perform an experiment to learn about how different types of marine debris degrade and how weather and sunlight affect the rate of degradation.
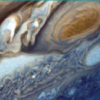
Weather Stations: Storms
Source Institutions
In this activity, learners test how cornstarch and glitter in water move when disturbed. Learners compare their observations with videos of Jupiter's and Earth's storm movements.
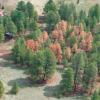
Bark Beetle Infestation Investigation: Estimation and Pheromones
Source Institutions
This activity investigates how bark beetles can threaten forests by having learners estimate the number of infected trees from a photo.
Measuring and Protecting Skin
Source Institutions
In this activity, learners compare and contrast their own skin (including the area covered) with that of an orange.

Living Clocks
Source Institutions
In this activity about daily rhythms (on page 17 of the PDF), learners will explore circadian patterns in humans, animals and plants.

What does Color have to do with Cooling?
Source Institutions
In this demonstration/experiment, learners discover that different colors and materials (metals, fabrics, paints) radiate different amounts of energy and therefore, cool at different rates.
Designer Seeds
Source Institutions
In this activity, learners will examine a variety of seeds, describe them, and determine how they are dispersed.

Chilean Sea Bass: Off the Menu
Source Institutions
In this data analysis activity, learners use data collected by the Commission for the Conservation of Antarctic Marine Living Resources (CCAMLR) to study Chilean sea bass populations.