Search Results
Showing results 1 to 14 of 14

A Funny Taste
Source Institutions
In this activity, learners explore the different salinities of various sources of water by taste-testing.

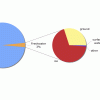
A Recipe for Air
Learners use M&Ms® (or any other multi-color, equally-sized small candy or pieces) to create a pie graph that expresses the composition of air.

The Scoop on Scallops
Source Institutions
In this data analysis activity, learners quantify the abundance and distribution of sea scallops in and adjacent to the Mid-Atlantic closed areas.
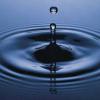
Earth's Water: A Drop in Your Cup
Source Institutions
This creative lesson plan provides a visual way for learners to gain knowledge about the finite amount of fresh water on Earth and encourages the discussion of the various ways to conserve this resour
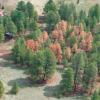
Bark Beetle Infestation Investigation: Estimation and Pheromones
Source Institutions
This activity investigates how bark beetles can threaten forests by having learners estimate the number of infected trees from a photo.
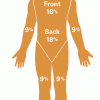
Measuring and Protecting Skin
Source Institutions
In this activity, learners compare and contrast their own skin (including the area covered) with that of an orange.

Chilean Sea Bass: Off the Menu
Source Institutions
In this data analysis activity, learners use data collected by the Commission for the Conservation of Antarctic Marine Living Resources (CCAMLR) to study Chilean sea bass populations.
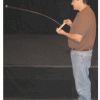
Inverted Foucault Pendulum
Source Institutions
In this demonstration, learners explore a variation of a Foucault pendulum, but upside down.
Determining the Amount of Transpiration from a Schoolyard Tree
Source Institutions
In this activity, learners calculate the number of milliliters of water a nearby tree transpires per day.

Earth Atmosphere Composition
Source Institutions
In this activity, learners use rice grains to model the composition of the atmosphere of the Earth today and in 1880. Learners assemble the model while measuring percentages.
The Blue Crab's Chesapeake Journey
Source Institutions
In this data collection activity about crabs, learners use data from the Virginia Institute of Marine Science (VIMS) trawl survey to determine the areas of the Chesapeake Bay that are being used by bl
Atmosphere Composition Model
Source Institutions
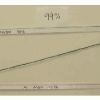
In this activity, learners create a model using metric measuring tapes and atmosphere composition data.
Earth's Water: A Drop in Your Cup
Source Institutions
This creative lesson plan provides a visual way for learners to gain knowledge about the finite amount of fresh water on Earth and encourages the discussion of the various ways to conserve this resour
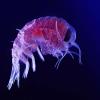
Amphipods: More than Mud
Source Institutions
In this data analysis and environmental science activity, learners examine the effects of pollution on amphipods using data from the Chesapeake Ecotox Research Program.