Search Results
Showing results 1 to 7 of 7
Growing Plants: Track Their Growth
Source Institutions
In this activity, learners will be working with predictions with a time frame of one week, or longer. Start by planting seedlings.

Tree-mendous Plots
Source Institutions
In this math lesson, learners record and graph plant growth and interpret data. Learners plant seeds, and once the seeds sprout, record the change in height of the plants for several days.
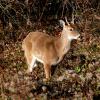
Population Study Game: Oh, Deer!
Source Institutions
In this activity, learners model a population of deer and see how the number of deer changes over time.

Zoo Calendar
Source Institutions
Use the Zoo Calendar (page 1 of PDF) to involve learners in interdisciplinary, whole language, and writing activities about ecological concepts.
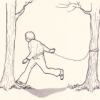
Tree Tally
Source Institutions
In this outdoor activity and fun race, learners first find the most common type of tree in a forest site.

Arctic Sea Ice
Source Institutions
In this activity, learners explore how the area of Arctic sea ice has changed over recent years. First, learners graph the area of Arctic sea ice over time from 1979 to 2007.
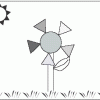
Bloomin' Bud Glyph
Source Institutions
In this math lesson, learners practice reading charts and graphs by creating and interpreting glyphs.