Search Results
Showing results 21 to 40 of 49
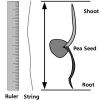
Easy PEAsy Seed Germination
Source Institutions
In this activity, learners determine the necessary conditions for pea seed germination.
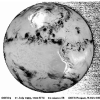
Weather Stations: Winds
Source Institutions
In this activity, learners use a toaster to generate wind and compare the appliance's heat source to Jupiter's own hot interior. Learners discover that convection drives wind on Jupiter and on Earth.
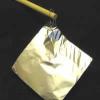
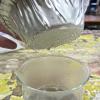
Weather Stations: Phase Change
Source Institutions
In this activity, learners observe the water cycle in action! Water vapor in a tumbler condenses on chilled aluminum foil — producing the liquid form of water familiar to us as rain and dew.
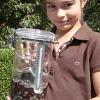
Make a Terrarium
Source Institutions
In this activity, learners make a miniature greenhouse or "terrarium" to explore the greenhouse effect.
Effects of Solar Radiation on Land and Sea
Source Institutions
In this activity, learners explore the different heating properties of soil and water.
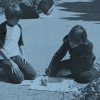
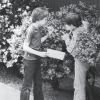
Plant Patterns
Source Institutions
In this outdoor mapping activity, learners explore where plants grow and map plant-distribution patterns.
How does the Atmosphere keep the Earth Warmer?
Source Institutions
In this activity, learners simulate the energy transfer between the earth and space by using the light from a desk lamp desk lamp with an incandescent bulb and a stack of glass plates.
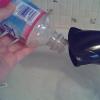
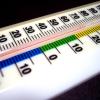
Air Pressure
Source Institutions
In this experiment, learners use a blow dryer and water bottle to observe and record changes in air pressure caused by changes in temperature.

Heat Capacity: Can't Take the Heat?
Source Institutions
Why is ocean water sometimes the warmest when the average daily air temperature starts to drop? In this activity, learners explore the differing heat capacities of water and air using real data.
Differing Densities: Fresh and Salt Water
Source Institutions
In this activity, learners visualize the differences in water density and relate this to the potential consequences of increased glacial melting.

Saguaro Nest Cavities
Source Institutions
This activity (on page 3 of the PDF under GPS: Cactus Activity) is a full inquiry investigation into how some desert birds keep their cool.
Canned Heat
Source Institutions
In this activity, learners explore how light and dark colored objects absorb the Sun's radiations at different rates.

Chocolate (Sea Floor) Lava
Source Institutions
In this edible experiment, learners pour "Magic Shell" chocolate into a glass of cold water. They'll observe as pillow shaped structures form, which resemble lavas on the sea floor.

The Daily Ups and Downs
Source Institutions
In this activity, learners graph 48 hourly air temperatures from a local weather observation site and observe the diurnal temperature variations.
Plants Around a Building
Source Institutions
In this outdoor activity, learners discover how the environment around a building affects the growth of plants.
Wonderful Weather
Source Institutions
In this activity, learners conduct three experiments to examine temperature, the different stages of the water cycle, and how convection creates wind.

Avogadro's Bubbly Adventure
Source Institutions
In this activity on page 7 of the PDF, learners investigate the solubility of gas in water at different temperatures. This experiment will help learners determine if temperature affects solubility.
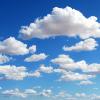
What is a "Model"?
Source Institutions
In this activity, learners simulate the behavior of the atmosphere.
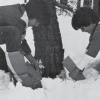
Wintergreen
Source Institutions
In this outdoor, winter activity, learners find living green plants under the snow and determine the light and temperature conditions around the plants.

What does Color have to do with Cooling?
Source Institutions
In this demonstration/experiment, learners discover that different colors and materials (metals, fabrics, paints) radiate different amounts of energy and therefore, cool at different rates.