Search Results
Showing results 1 to 16 of 16
Measuring Biodiversity
Source Institutions
Learners use a variety of beans to represent a variety of species, and scatter these beans over a large piece of paper representing the environment.
Woodlands Map
Source Institutions
This is a culminating activity which allows learners to summarize what they know about Woodlands Native Americans by creating illustrations and map symbols for a large outline map (see related Activit

Mapping Sea Level Rise
Source Institutions
In this activity related to climate change, learners create and explore topographical maps as a means of studying sea level rise.

Avogadro's Bubbly Adventure
Source Institutions
In this activity on page 7 of the PDF, learners investigate the solubility of gas in water at different temperatures. This experiment will help learners determine if temperature affects solubility.
Personal Time Line
Source Institutions
In this activity, learners work in groups to create a time line representing significant moments in their lives.
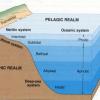
Introduction to Ocean Zones
Source Institutions
In this activity, learners will create a diagram of the ocean zones and determine what organisms live in each zone.
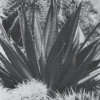
Cactus Wheel
Source Institutions
In this outdoor activity/field trip, learners explore the concept of population density.
Breaking Point
Source Institutions
In this activity, learners build penetrometers to test leaf toughness. Biologists measure leaf toughness to study the feeding preferences of insects and bugs.
What's the Angle?
Source Institutions
This activity helps learners understand how the angle of the Sun affects temperatures around the globe.
Dinosaur Breath
Through discussion and hands-on experimentation, learners examine the geological (ancient) carbon cycle.
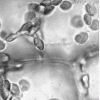
Magnifying and Observing Cells
Source Institutions
In this activity related to microbes, learners make slides of cells from an onion skin and Elodea (American or Canadian waterweed) to observe under a microscope.
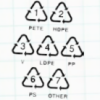
Sink or Swim?
Source Institutions
In this activity, learners identify different plastics in a mystery bag. Learners discover that plastics are classified #1 through #7.
Atmosphere Composition Model
Source Institutions
In this activity, learners create a model using metric measuring tapes and atmosphere composition data.

Energy Use in the Americas
Source Institutions
Learners explore the relationship between energy consumption, population, and carbon emissions in the countries of the Americas.
Show Your Colors!
Source Institutions
In this family or group activity, learners conduct a chromatography experiment to reveal the colors that leaves "hide" under their green pigments.
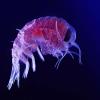
Amphipods: More than Mud
Source Institutions
In this data analysis and environmental science activity, learners examine the effects of pollution on amphipods using data from the Chesapeake Ecotox Research Program.