Search Results
Showing results 1 to 20 of 25
From the Internet to Outer Space
Source Institutions
In this activity, learners will use Google Sky to observe features of the night sky and share their observations.
Glaciers
Source Institutions
In this online activity, learners adjust mountain snowfall and temperature to see how glaciers grow and shrink. They will use scientific tools to measure thickness, velocity and glacial budget.

The Rumblin' Road: Determining distance to a Thunderstorm
Source Institutions
In this activity, learners discover how to determine the distance to a lightning strike or nearby thunderstorm.

Quadraphonic Wind
Source Institutions
In this activity, learners discover how the extent of various wind speeds changes in each of the four quadrants around a hurricane.

A Cubic Foot Per Second
Source Institutions
In this activity, learners measure and calculate the amount of cubic feet various containers contain. Next, learners investigate cubic feet per second (cps), by carrying jugs in one second.

Whose Fault Is It?
Source Institutions
In this seismic simulation, learners play a "who-dunnit" game to explore earthquakes.

Arctic Sea Ice
Source Institutions
In this activity, learners explore how the area of Arctic sea ice has changed over recent years. First, learners graph the area of Arctic sea ice over time from 1979 to 2007.
Piles of Paper: Estimate Paper Use
Source Institutions
In this activity, learners keep track of how much paper the group uses in a week. Build awareness of paper waste, while strengthening measurement and estimation skills.
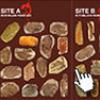
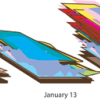
Prehistoric Climate Change
Source Institutions
In this online interactive, learners use fossils to infer temperatures 55 million years ago, at the sites where the fossils were found.
Fish Eyes: More than Meets the Eye
Source Institutions
In this data collection and analysis activity, learners evaluate fish physiology and ecology using vision research data from Dr.
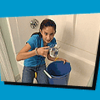
Shower Estimation
Source Institutions
In this activity, learners calculate their water usage (in cups and galloons) during an average shower. Learners also chart and analyze water usage during showers in their households.

The Daily Ups and Downs
Source Institutions
In this activity, learners graph 48 hourly air temperatures from a local weather observation site and observe the diurnal temperature variations.
The Return of El Nino
Source Institutions
In this activity related to climate change and data analysis, learners examine temperature and precipitation data to determine if climate variations are due to El Niño.

Nano Scavenger Hunt
Source Institutions
This is an activity (located on page 3 of PDF under Where's Nano? Activity) about identifying nanoscale objects and phenomena in today's world.
Tsunami: Waves of Destruction
Source Institutions
In this activity, learners use tsunami time travel maps to predict how long it will take a tsunami to reach the shore.
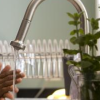
Home Water Audit
Source Institutions
This activity offers learners and their families several ways to raise their awareness together about home water.
Harmful Algal Blooms: In Full Bloom
Source Institutions
In this activity, learners will investigate the impacts of harmful phytoplankton using NOAA's Coastal Services Center Harmful Algal Bloom Forecasting (HABF) Project data.
Atmospheric Collisions
Source Institutions
In this activity/demonstration, learners observe what happens when two ping pong balls are suspended in the air by a hair dryer. Use this activity to demonstrate how rain drops grow by coalescence.

The Shadow Knows I
Source Institutions
In this activity, learners will measure the length of their shadow from the Sun and compare it three to four months later.

Drawing Conclusions
Source Institutions
In this weather forecasting activity, learners determine the location of cold and warm fronts on weather plot maps.