Search Results
Showing results 1 to 17 of 17
Disease Detective
Source Institutions
This activity (on pages 35-43) lets learners analyze a "herd of elk" to detect the spread of a bacterial disease called brucellosis.
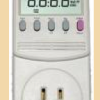
Plugged in to CO2
Source Institutions
In this activity, learners investigate various appliances and electronics, discovering how much energy each uses and how much carbon dioxide (CO2) is released to produce that energy.

Arctic Sea Ice
Source Institutions
In this activity, learners explore how the area of Arctic sea ice has changed over recent years. First, learners graph the area of Arctic sea ice over time from 1979 to 2007.

Mapping Sea Level Rise
Source Institutions
In this activity related to climate change, learners create and explore topographical maps as a means of studying sea level rise.
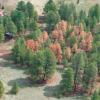
Bark Beetle Infestation Investigation: Estimation and Pheromones
Source Institutions
This activity investigates how bark beetles can threaten forests by having learners estimate the number of infected trees from a photo.

The Daily Ups and Downs
Source Institutions
In this activity, learners graph 48 hourly air temperatures from a local weather observation site and observe the diurnal temperature variations.
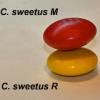
Survival of the Fittest: Variations in the Clam Species Clamys sweetus
Source Institutions
This guided inquiry three-part activity engages learners in thinking about the mechanism of natural selection by encouraging them to formulate questions that can be answered through scientific investi
Survival of the Fittest: Battling Beetles
Source Institutions
This guided inquiry three-part activity engages learners in thinking about the mechanism of natural selection through data collection and pattern recognition.
Weather Forecasting
Source Institutions
This activity (on page 2 of the PDF under SciGirls Activity: Forecasting) is a full inquiry investigation into meteorology and forecasting.

Drawing Conclusions
Source Institutions
In this weather forecasting activity, learners determine the location of cold and warm fronts on weather plot maps.

Tree-mendous Plots
Source Institutions
In this math lesson, learners record and graph plant growth and interpret data. Learners plant seeds, and once the seeds sprout, record the change in height of the plants for several days.

Forward Thinking
Source Institutions
In this activity, learners create their own weather forecast map.

If Anyone Can, Icon
Source Institutions
In this activity, learners create their own icons for a forecast-at-a-glance poster for their classroom/learning space.
Sharks: Taking a Bite Out of The Myth
Source Institutions
In this activity, learners will explore trends in shark populations using shark landing data from the National Marine Fisheries Service.
Statistics: Creature Features
Source Institutions
In this math activity, learners collect, organize, and analyze a set of data related to types of animals in the temperate forest.
Dinosaur Skull and Body Length Predictions
Source Institutions
In this activity (located on page 2 of PDF under GPS: Baby Dinosaurs Activity), learners will look for a relationship between skull size and body length among various dinosaurs.
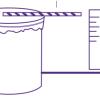
Make Your Own Weather Station
Source Institutions
This three-part activity shows learners how to build three meteorology tools: a wind vane, a rain gauge, and a barometer.