Search Results
Showing results 41 to 60 of 77
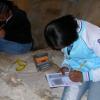
Fossil Age Estimation Model
Source Institutions
In this activity (page 1 of the PDF under SciGirls Activity: Dinosaurs), learners will model how paleontologists estimate the age of fossil discoveries by extracting “fossil” playing cards from newspa
The Return of El Nino
Source Institutions
In this activity related to climate change and data analysis, learners examine temperature and precipitation data to determine if climate variations are due to El Niño.

Nano Scavenger Hunt
Source Institutions
This is an activity (located on page 3 of PDF under Where's Nano? Activity) about identifying nanoscale objects and phenomena in today's world.

Earth Atmosphere Composition
Source Institutions
In this activity, learners use rice grains to model the composition of the atmosphere of the Earth today and in 1880. Learners assemble the model while measuring percentages.
Plenty on the Plains
Source Institutions
In this activity, learners compare the ways of life of Plains Native Americans who hunted and moved frequently to follow the buffalo herds, and Native Americans who farmed and lived in more permanent
Simple Submarine
Source Institutions
Using simple, inexpensive items, learners build and test submarine models.

Home Water Audit
Source Institutions
This activity offers learners and their families several ways to raise their awareness together about home water.
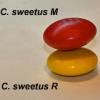
Survival of the Fittest: Variations in the Clam Species Clamys sweetus
Source Institutions
This guided inquiry three-part activity engages learners in thinking about the mechanism of natural selection by encouraging them to formulate questions that can be answered through scientific investi
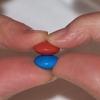
Survival of the Fittest: Battling Beetles
Source Institutions
This guided inquiry three-part activity engages learners in thinking about the mechanism of natural selection through data collection and pattern recognition.
Atmosphere Composition Model
Source Institutions
In this activity, learners create a model using metric measuring tapes and atmosphere composition data.
Trees: Recorders of Climate Change
Source Institutions
In this activity, learners are introduced to tree rings by examining a cross section of a tree, also known as a “tree cookie.” They discover how tree age can be determined by studying the rings and ho

Zero-Energy Housing
In this activity, learners investigate passive solar building design with a focus solely on heating.
Malformed Frogs
Source Institutions
This activity (on page 2 of the PDF under SciGirls Activity: Malformed Frogs) is a full inquiry investigation into using indicator species to assess the health of an environment.
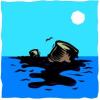
Oil Spill Cleanup
This hands-on experiment will provide learners with an understanding of the issues that surround environmental cleanup.

Drawing Conclusions
Source Institutions
In this weather forecasting activity, learners determine the location of cold and warm fronts on weather plot maps.
Signs of Change: Studying Tree Rings
Source Institutions
In this very hands-on lesson, learners will investigate dendrochronology (the study of tree rings to answer ecological questions about the recent past) and come up with conclusions as to what possible

Tree-mendous Plots
Source Institutions
In this math lesson, learners record and graph plant growth and interpret data. Learners plant seeds, and once the seeds sprout, record the change in height of the plants for several days.

Forward Thinking
Source Institutions
In this activity, learners create their own weather forecast map.
Waves: An Alternative Energy Source
Source Institutions
In this data analysis and environmental science activity, learners evaluate the feasibility of wave energy as a practical alternative energy source using ocean observing system (OOS) buoys.

If Anyone Can, Icon
Source Institutions
In this activity, learners create their own icons for a forecast-at-a-glance poster for their classroom/learning space.