Search Results
Showing results 1 to 20 of 31
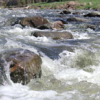
Chemical Footprint—Family Activity
Source Institutions
In this multi-part activity learners examine non-point water pollution.
Mercury in the Environment
Source Institutions
In this environmental science lesson, learners will examine the dangers of mercury and how humans contribute to growing mercury emissions on Earth.
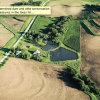
Positive Planning Adds Up
Source Institutions
In this drawing/mapping activity, learners design plots of land while incorporating positive strategies for improving water quality.
Let's Count Humpback Whales: Environmental Effects on Population
Source Institutions
In this activity, learners use whale count data from the Hawaiian Islands Humpback Whale National Marine Sanctuary to compare whale counts in relation to environmental factors.
Coastal Erosion: Where's the Beach?
Source Institutions
Learners use beach profile data from a local beach or online data from Ocean City, Maryland to investigate coastal erosion and sediment transport.
Fish Communities: National Marine Sanctuaries
Source Institutions
In this data activity, learners will compare and contrast fish communities, diversity and habitats in U.S. National Marine Sanctuaries.

The Scoop on Scallops
Source Institutions
In this data analysis activity, learners quantify the abundance and distribution of sea scallops in and adjacent to the Mid-Atlantic closed areas.
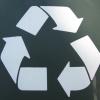
The Recycling Conservation Calculator
Source Institutions
In this environmental activity (page 16 of the PDF), learners will calculate the amount of energy they save by recycling paper, plastic, glass, and aluminum materials over the span of a week.
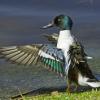
For the Birds: Environmental Effects on Population
Source Institutions
In this activity, learners will investigate how shorebirds and seabirds are extremely vulnerable to changes in their environment, whether human-induced or otherwise.

Chilean Sea Bass: Off the Menu
Source Institutions
In this data analysis activity, learners use data collected by the Commission for the Conservation of Antarctic Marine Living Resources (CCAMLR) to study Chilean sea bass populations.

Coral Snapshots: Biodiversity in Marine Protected Areas
Source Institutions
In this data activity, learners analyze data from coral reef snapshots taken by scientists at the Virginia Institute of Marine Science.
Sustainable Fishing
Source Institutions
In this activity, learners use a model for how fishing affects marine life populations, and will construct explanations for one of the reasons why fish populations are declining.
Differing Densities: Fresh and Salt Water
Source Institutions
In this activity, learners visualize the differences in water density and relate this to the potential consequences of increased glacial melting.
Going Green
Source Institutions
In this activity, learners conduct a waste audit and use their findings to implement a plan for reducing trash.
Who Dirtied The Water?
Source Institutions
In this activity, learners receive a labeled plastic film canister containing a material representing a pollutant (i.e. pencil shavings = a beaver's wood chips).
Building a Community From the Ground Up
Source Institutions
In this activity, a group of learners work collaboratively to design and construct a paper model showing the evolution of an environment through multiple stages, from prehistory through the modern cit
Hazardous Chemicals in Your Neighborhood
Source Institutions
In this environmental science lesson, learners will examine hazardous chemicals and their effects on human health and the environment.
The Blue Crab's Chesapeake Journey
Source Institutions
In this data collection activity about crabs, learners use data from the Virginia Institute of Marine Science (VIMS) trawl survey to determine the areas of the Chesapeake Bay that are being used by bl
The Carbon Cycle: Carbon Tracker
Source Institutions
In this activity, learners play NOAA's Carbon Tracker game and discover ways to keep track of carbon dioxide and other greenhouse gases in the world.
Harmful Algal Blooms: In Full Bloom
Source Institutions
In this activity, learners will investigate the impacts of harmful phytoplankton using NOAA's Coastal Services Center Harmful Algal Bloom Forecasting (HABF) Project data.