Search Results
Showing results 1 to 20 of 21

Good News: We're on the Rise!
Learners build a simple aneroid barometer to learn about changes in barometric pressure and weather forecasting. They observe their barometer and record data over a period of days.

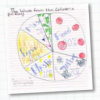
A Recipe for Air
Learners use M&Ms® (or any other multi-color, equally-sized small candy or pieces) to create a pie graph that expresses the composition of air.
Composting
Source Institutions
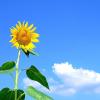
In this environmental science activity, learners research what is essential for plant life and the necessary components of soil to support plants.

Rooftop Gardens
How does a green roof, or roof covered by plants, affect the temperature of the inside and outside of a building? Learners design and build houses to find out the answer.
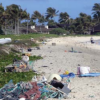
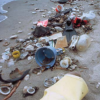
A Scientific Cleanup
Source Institutions
This is a comprehensive lesson plan on page 85 for a group cleanup trip to a local beach, lake or stream. Learners keep track of the types and amounts of trash picked up and analyze this information.
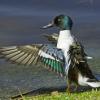
For the Birds: Environmental Effects on Population
Source Institutions
In this activity, learners will investigate how shorebirds and seabirds are extremely vulnerable to changes in their environment, whether human-induced or otherwise.
What Color is Your Air Today?
Learners develop awareness and understanding of the daily air quality using the Air Quality Index (AQI) listed in the newspaper or online.
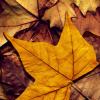
Shapes and Colors and Textures, Oh My!
Source Institutions
This is an activity about discovering the colors and beauty of nature. Learners will spend time outdoors, matching paint chip samples, colored paper, or colors of clothing to those found in nature.

A Degrading Experience
Source Institutions
In this activity on page 27, learners perform an experiment to learn about how different types of marine debris degrade and how weather and sunlight affect the rate of degradation.
Biodiversity of Feet
Source Institutions
This activity (on page 3 of the PDF under GPS: Biodiversity Activity) is a full inquiry investigation into biodiversity.

Pollution Patrol
Source Institutions
In this activity, learners explore how engineers design devices that can detect the presence of pollutants in the air.
Trash Traits
Source Institutions
In this activity on page 24, learners perform experiments to examine whether or not trash can float, blow around, or wash away.

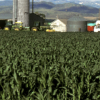
How Might Elevated CO2 Affect Plants
Source Institutions
In this activity, learners conduct an experiment to investigate the effect of elevated levels on CO2 on plant growth.

Zoo Calendar
Source Institutions
Use the Zoo Calendar (page 1 of PDF) to involve learners in interdisciplinary, whole language, and writing activities about ecological concepts.
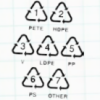
Sink or Swim?
Source Institutions
In this activity, learners identify different plastics in a mystery bag. Learners discover that plastics are classified #1 through #7.
Going Green
Source Institutions
In this activity, learners conduct a waste audit and use their findings to implement a plan for reducing trash.
Global Climate Change and Sea Level Rise
Source Institutions
In this activity, learners practice the steps involved in a scientific investigation while learning why ice formations on land (not those on water) will cause a rise in sea level upon melting.
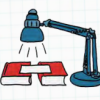
Light Bulb Challenge
Source Institutions
In this activity, learners explore the difference between compact fluorescent light (CFL) bulbs and traditional incandescent bulbs.
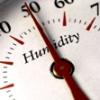
Making Sense of Sensors
Source Institutions
In this activity, learners explore sensors and focus specifically on how to measure humidity using a sensor.
Let's Count Humpback Whales: Environmental Effects on Population
Source Institutions
In this activity, learners use whale count data from the Hawaiian Islands Humpback Whale National Marine Sanctuary to compare whale counts in relation to environmental factors.