Search Results
Showing results 1 to 20 of 20
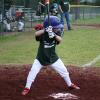
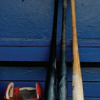
Batter Up!
Source Institutions
This activity (on page 3 of the PDF under GPS: Baseball Activity) is a full inquiry investigation into how "bounciness" relates to the distance a ball will fly when hit off a batting tee.
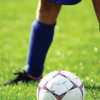
Soccer
Source Institutions
In this math activity (Page 12 of the Play Ball! PDF), learners play a game of "soccer" and analyze the results of the game.
Quick Questions: Create a Survey
Source Institutions
In this activity, learners will conduct an open-ended survey, and then organize and analyze results. What languages does everyone speak? What’s the most common? the least common?
Plot the Dot: A Graphical Approach to Density
Source Institutions
In this activity, learners work in groups to determine the mass and volume of four samples: glass marbles, steel washers or nuts, pieces of pine wood, and pieces of PVC pipe.
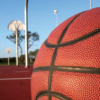
Basketball
Source Institutions
In this math activity (Page 14 of the Play Ball! PDF), learners play a game of "basketball" and analyze the results of the game.
Graph Dance
Source Institutions
In this activity, learners "dance" (move back and forth at varying speeds) by reading a graph. This is a kinesthetic way to help learners interpret and understand how motion is graphed.

Arctic Sea Ice
Source Institutions
In this activity, learners explore how the area of Arctic sea ice has changed over recent years. First, learners graph the area of Arctic sea ice over time from 1979 to 2007.
Starburst® Graph
Source Institutions
In this activity, learners use Starburst® candy to sort, classify, compare, and graph. Learners grab a handful of one-inch candy squares, sort them by color, graph the candy, and discuss the results.
Gravity Fountains
Source Institutions
This activity (located on page 3 of the PDF under GPS: Glaciers Activity) is a full inquiry investigation into the forces of gravity and air pressure.
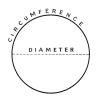
Pi Graph
Source Institutions
In this activity, learners use a straight line to learn about circles. Learners measure and record the diameter and circumference of different sized cylindrical objects on a chart.

Pi Toss
Source Institutions
In this activity, learners explore a surprising method for calculating the mathematical constant pi, known as Buffon's Needle.
Transit Tracks
Source Institutions
In this space science activity, learners explore transits and the conditions when a transit may be seen.
Baseball
Source Institutions
In this math activity (Page 17 of the Play Ball! PDF), learners play a game of "baseball" and analyze the results of the game.
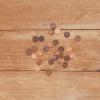
Radioactive-Decay Model: Substitute coins for radiation
Source Institutions
Get a roll of pennies, throw them on the ground, then remove those that only show tails, and repeat with the ones left over.
Cardio Comparisons
Source Institutions
In this activity, learners discover how their heart rate changes in different situations.
Breakfast Sweets
Source Institutions
In this math activity, learners guess which cereals contain the most sugar. Learners use the nutrition labels on the cereal boxes to find the cereal with the least amount of sugar.
The Muddy City: Minimal Spanning Trees
Source Institutions
In this puzzle, learners investigate the decisions involved in linking a network between houses in a muddy city.

Tree-mendous Plots
Source Institutions
In this math lesson, learners record and graph plant growth and interpret data. Learners plant seeds, and once the seeds sprout, record the change in height of the plants for several days.
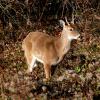
Population Study Game: Oh, Deer!
Source Institutions
In this activity, learners model a population of deer and see how the number of deer changes over time.

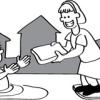
Zoo Calendar
Source Institutions
Use the Zoo Calendar (page 1 of PDF) to involve learners in interdisciplinary, whole language, and writing activities about ecological concepts.