Search Results
Showing results 1 to 20 of 21
Soccer
Source Institutions
In this math activity (Page 12 of the Play Ball! PDF), learners play a game of "soccer" and analyze the results of the game.
A Place in Space
Source Institutions
Learners construct and use a "real" 3D coordinate system out of balsa wood and foam core. They will then be able to locate coordinates in space.
Basketball
Source Institutions
In this math activity (Page 14 of the Play Ball! PDF), learners play a game of "basketball" and analyze the results of the game.
Graph Dance
Source Institutions
In this activity, learners "dance" (move back and forth at varying speeds) by reading a graph. This is a kinesthetic way to help learners interpret and understand how motion is graphed.
Bloomin' Bud Glyph
Source Institutions
In this math lesson, learners practice reading charts and graphs by creating and interpreting glyphs.
Starburst® Graph
Source Institutions
In this activity, learners use Starburst® candy to sort, classify, compare, and graph. Learners grab a handful of one-inch candy squares, sort them by color, graph the candy, and discuss the results.
Gravity Fountains
Source Institutions
This activity (located on page 3 of the PDF under GPS: Glaciers Activity) is a full inquiry investigation into the forces of gravity and air pressure.
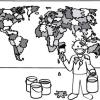
The Poor Cartographer: Graph Coloring
Source Institutions
In this activity, learners help a poor cartographer color in the countries on a map, making sure each country is colored a different color than any of its neighbors.
Transit Tracks
Source Institutions
In this space science activity, learners explore transits and the conditions when a transit may be seen.
Baseball
Source Institutions
In this math activity (Page 17 of the Play Ball! PDF), learners play a game of "baseball" and analyze the results of the game.
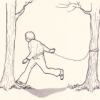
Tree Tally
Source Institutions
In this outdoor activity and fun race, learners first find the most common type of tree in a forest site.
FlyBy Math: Distance-Rate-Time Problems in Air Traffic Control
Source Institutions
In this small-group activity, learners assume the roles of pilots, air traffic controllers, and NASA scientists to solve five Air Traffic Control (ATC) problems.
Cardio Comparisons
Source Institutions
In this activity, learners discover how their heart rate changes in different situations.
Breakfast Sweets
Source Institutions
In this math activity, learners guess which cereals contain the most sugar. Learners use the nutrition labels on the cereal boxes to find the cereal with the least amount of sugar.
The Muddy City: Minimal Spanning Trees
Source Institutions
In this puzzle, learners investigate the decisions involved in linking a network between houses in a muddy city.

Tree-mendous Plots
Source Institutions
In this math lesson, learners record and graph plant growth and interpret data. Learners plant seeds, and once the seeds sprout, record the change in height of the plants for several days.
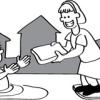
Tourist Town: Dominating Sets
Source Institutions
In this activity, learners use a fictitious map of "Tourist Town" and counters to problem solve how to place ice-cream vans on street intersections so that every other intersection is connected to one
Patterns and Functions: Fill 'er Up
Source Institutions
In this math lesson, learners predict, interpret, and sketch graphs of functions related to the shapes of bottles. A measure of water is poured into a container.
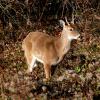
Population Study Game: Oh, Deer!
Source Institutions
In this activity, learners model a population of deer and see how the number of deer changes over time.

Zoo Calendar
Source Institutions
Use the Zoo Calendar (page 1 of PDF) to involve learners in interdisciplinary, whole language, and writing activities about ecological concepts.