Search Results
Showing results 1 to 20 of 34
Mercury in the Environment
Source Institutions
In this environmental science lesson, learners will examine the dangers of mercury and how humans contribute to growing mercury emissions on Earth.
Let's Count Humpback Whales: Environmental Effects on Population
Source Institutions
In this activity, learners use whale count data from the Hawaiian Islands Humpback Whale National Marine Sanctuary to compare whale counts in relation to environmental factors.

The Scoop on Scallops
Source Institutions
In this data analysis activity, learners quantify the abundance and distribution of sea scallops in and adjacent to the Mid-Atlantic closed areas.
Sea State: Forecast Conditions at Sea
Source Institutions
In this oceanography and data collection activity, learners cast real time sea state conditions using buoys from NOAA's National Data Buoy Center.
Calendarios para cualquier año
Source Institutions
Este Web site contiene links a 12 calendarios (12 meses). Cada mes contiene actividades sobre matemáticas.

Double Dutch Distractions
Source Institutions
This activity (page 2 of the PDF under SciGirls Activity: Double Dutch) is a full inquiry investigation into whether hearing or seeing has a bigger effect on jump rope performance.
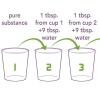
Sniffing for a Billionth
Source Institutions
This is an activity (located on page 4 of the PDF under What's Nano? Activity) about size and scale.
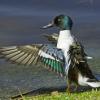
For the Birds: Environmental Effects on Population
Source Institutions
In this activity, learners will investigate how shorebirds and seabirds are extremely vulnerable to changes in their environment, whether human-induced or otherwise.
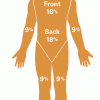
Measuring and Protecting Skin
Source Institutions
In this activity, learners compare and contrast their own skin (including the area covered) with that of an orange.
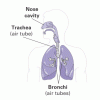
Heart and Lungs
Source Institutions
In this environmental health activity, learners investigate their breathing and pulse rates, and learn how these measurements are affected by physical activity.

Statistics: Steppin' Out
Source Institutions
In this math lesson, learners construct box-and-whisker plots to analyze and compare data sets. Learners investigate whether or not long-legged people run faster than short-legged people.

Chilean Sea Bass: Off the Menu
Source Institutions
In this data analysis activity, learners use data collected by the Commission for the Conservation of Antarctic Marine Living Resources (CCAMLR) to study Chilean sea bass populations.
Wetland Bioblitz
Source Institutions
This activity (located on page 3 of the PDF under GPS: Temperate Rain Forest Activity) is a full inquiry investigation into biodiversity of a given habitat.

Nutritional Challenges
Source Institutions
In this nutrition activity (page 26 of PDF), learners consider the nutritional needs of people with specific dietary requirements, such as athletes, persons with diabetes and vegetarians, and create a
Tree Trunk Diameter to Branch Height Relationship
Source Institutions
In this activity (located on page 2 of the PDF under GPS: Temperate Rain Forest Activity), learners will identify a group of deciduous trees to study.
Fish Eyes: More than Meets the Eye
Source Institutions
In this data collection and analysis activity, learners evaluate fish physiology and ecology using vision research data from Dr.
Going Green
Source Institutions
In this activity, learners conduct a waste audit and use their findings to implement a plan for reducing trash.
The Return of El Nino
Source Institutions
In this activity related to climate change and data analysis, learners examine temperature and precipitation data to determine if climate variations are due to El Niño.

Earth Atmosphere Composition
Source Institutions
In this activity, learners use rice grains to model the composition of the atmosphere of the Earth today and in 1880. Learners assemble the model while measuring percentages.
Not Just A Bag Of Beans
Source Institutions
In this activity, learners count and measure kidney beans to explore natural selection and variation. Learners measure the length of 50-100 beans.