Search Results
Showing results 1 to 20 of 21
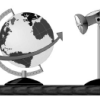
The Geophysical Light/Dark Cycle
Source Institutions
This is an activity (located on page 131 of the PDF) related to sleep and circadian rhythms as well as space travel.

Arctic Sea Ice
Source Institutions
In this activity, learners explore how the area of Arctic sea ice has changed over recent years. First, learners graph the area of Arctic sea ice over time from 1979 to 2007.
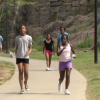
Workin' It Out
Source Institutions
In this activity, learners explore how to stay fit the fun way. Learners participate in three physical activities.
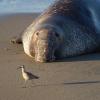
Natural Selection in Protected and Unprotected Populations
Source Institutions
In this simulation, learners model two elephant seal populations and how they change over time. Learners start with cards representing a variety of seals.
Hunting Minibeasts
Source Institutions
In this activity (p.6-10 of PDF), learners use different methods for hunting minibeasts (bugs). Learners can either make traps or simply look for minibeasts under stones and logs.

Mapping Greenhouse Gas Emissions Where You Live
Source Institutions
In this lesson plan, learners examine some of the of greenhouse gas emissions sources in their community.
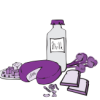
Special Snack: Budgeting for Health
Source Institutions
In this activity, learners will plan a snack within a budget. With a $20 limit (theoretical) to spend on snack for everyone, learners look over grocery store circulars and make their shopping lists.
Your Energy Needs
Source Institutions
In this activity about the relationship between food and energy (page 8 of PDF), learners estimate average daily baseline energy (Calorie) needs and energy needs for different levels of activity.
Building Blocks
Source Institutions
In this activity (page 32 of PDF), learners investigate the nutritional needs of healthy bones and muscles.

Coral Snapshots: Biodiversity in Marine Protected Areas
Source Institutions
In this data activity, learners analyze data from coral reef snapshots taken by scientists at the Virginia Institute of Marine Science.
Multitasking Mania
Source Institutions
In this activity, learners conduct scientific research on multitasking. Learners determine if multitasking with media while doing homework affects their ability to successfully complete the homework.
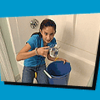
Shower Estimation
Source Institutions
In this activity, learners calculate their water usage (in cups and galloons) during an average shower. Learners also chart and analyze water usage during showers in their households.
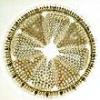
Diatom Ooze: Ooze Clues
Source Institutions
In this activity, learners will plot the distribution of various oozes using information from sediment maps.
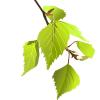
Exercise in Creating Drawings for Field Notebooks
Source Institutions
Learners draw and describe a leaf, and then re-find leaves drawn and described by other learners. Learners can observe leaves outside, or leaves may be brought into the classroom.
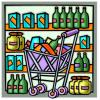
Supermarket Science: The King Sooper Lab
Source Institutions
In this investigation, learners gather information on various food items during a field trip to a local grocery store.
Energy Audit
Source Institutions
In this lesson, learners will practice graphing and statistically analyzing data.
The Search for Secret Agents
Learners tour their school or home looking for sources of indoor air pollutants (IAPs).
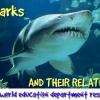
Sharks: Taking a Bite Out of The Myth
Source Institutions
In this activity, learners will explore trends in shark populations using shark landing data from the National Marine Fisheries Service.
Servings and Choices
Source Institutions
In this nutrition activity (page 16 of PDF), learners document their individual eating habits and learn whether their eating patterns meet their needs.
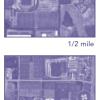
Aerial Imagery
Source Institutions
This activity (on page 2 of the PDF under SciGirls Activity: Earthquakes) is a full inquiry investigation into aerial imagery.