Search Results
Showing results 121 to 140 of 195
Liquid Crystal Thermometers
Source Institutions
In this activity, learners explore liquid crystal thermometers to observe how heat flows by conduction, convection, radiation, and evaporation.

Raising the Level of Carbon Dioxide in Your Blood
Source Institutions
In this activity (on page 146 of the PDF), learners will explore the effects of increased carbon dioxide in the bloodstream.

What is a Nanometer?
Source Institutions
This lesson focuses on how to measure at the nanoscale and provides learners with an understanding how small a nanometer really is.
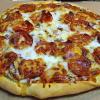
Food for the Brain
Source Institutions
In this activity, learners dissect a piece of pizza to learn about nutrients important for health.
Patterns and Relationships: Struts 'n Stuff
Source Institutions
In this math lesson, learners identify the relationship between the number of sides in a regular polygon and the number of struts needed to make each polygon rigid.
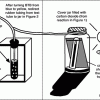
Sodium Acetate Hand Warmers
Source Institutions
In this activity, sodium acetate hand warmers are used to introduce learners to supersaturated solutions, crystallization, and exothermic reactions.
How Greenhouse Gases Absorb Heat
Source Institutions
Learners observe two model atmospheres -- one with normal atmospheric composition and another with an elevated concentration of carbon dioxide.
Airplane Wing Investigation
Source Institutions
This activity (located on page 3 of the PDF under GPS: Balloon Fiesta Activity) is a full inquiry investigation into Bernoulli’s principle and airplane wings.

Active Graphs
Source Institutions
In this activity, learners track their movements with jumping and leaping graphs.
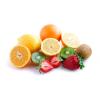
Pennies for Pits
Source Institutions
In this math lesson, learners use fruit to learn about proportions and percentages. Learners compare the weights of the edible and non-edible portions of fruit.
Metric Capers
Source Institutions
In this outdoor activity, learners measure familiar objects in nature to practice working with the metric system.
Atmosphere Composition Model
Source Institutions
In this activity, learners create a model using metric measuring tapes and atmosphere composition data.
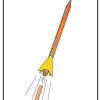
3...2...1 Puff!
Source Institutions
In this activity, learners build small indoor paper rockets, determine their flight stability, and launch them by blowing air through a drinking straw.

Terrestrial Hi-Lo Hunt
Source Institutions
In this outdoor activity, learners search for the warmest and coolest, windiest and calmest, wettest and driest, and brightest and darkest spots in an area.
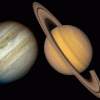
Planet Surfing
Source Institutions
In this astronomy activity (page 6 of the PDF), learners will compare and contrast two planets in the solar system using data obtained from the internet.
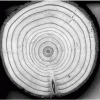
Trees: Recorders of Climate Change
Source Institutions
In this activity, learners are introduced to tree rings by examining a cross section of a tree, also known as a “tree cookie.” They discover how tree age can be determined by studying the rings and ho
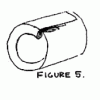
Cylindrical Wing
Source Institutions
In this design and physics challenge, learners construct a cylindrical wing, fly it, make modifications, and determine how the changes affect flight patterns.

Drawing Conclusions
Source Institutions
In this weather forecasting activity, learners determine the location of cold and warm fronts on weather plot maps.
Making Map Projections
Source Institutions
In this activity about cartography, learners work in teams to create two different map projections: a planar (or polar) and a cylindrical (or Mercator) projection.