Search Results
Showing results 1 to 18 of 18

Earth's Energy Cycle: Albedo
Source Institutions
In this activity, learners experiment and observe how the color of materials that cover the Earth affects the amounts of sunlight our planet absorbs.

Mapping Sea Level Rise
Source Institutions
In this activity related to climate change, learners create and explore topographical maps as a means of studying sea level rise.
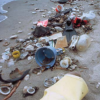
Trash Traits
Source Institutions
In this activity on page 24, learners perform experiments to examine whether or not trash can float, blow around, or wash away.

A Degrading Experience
Source Institutions
In this activity on page 27, learners perform an experiment to learn about how different types of marine debris degrade and how weather and sunlight affect the rate of degradation.
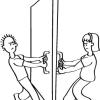
Vestibular-Ocular Reflex
Source Institutions
In this activity, learners will perform various investigations to understand the vestibular-ocular reflex and learn about the importance of visual cues in maintaining balance.
The Parachuting Egg
Source Institutions
In this activity, learners work in groups to design a parachute out of household items that keeps an egg secure when dropped from a certain height.
Human Interface Design: The Chocolate Factory
Source Institutions
In this activity about human interface design issues, learners help the Oompa-Loompas of a great chocolate factory solve different problems.
Trash Talkin'
In this activity, learners collect, categorize, weigh and analyze classroom trash and discuss ways that engineers have helped to reduce solid waste.
The Blue Crab's Chesapeake Journey
Source Institutions
In this data collection activity about crabs, learners use data from the Virginia Institute of Marine Science (VIMS) trawl survey to determine the areas of the Chesapeake Bay that are being used by bl
Harmful Algal Blooms: In Full Bloom
Source Institutions
In this activity, learners will investigate the impacts of harmful phytoplankton using NOAA's Coastal Services Center Harmful Algal Bloom Forecasting (HABF) Project data.
Oil Spill Cleanup
This hands-on experiment will provide learners with an understanding of the issues that surround environmental cleanup.
Automotive Emissions and the Greenhouse Effect
Source Institutions
In this activity about global climate change, learners will conduct an experiment and collect data to compare the amount of carbon dioxide (CO2) in four different sources of gases.
Give or Take?
Source Institutions
In this outdoor activity, learners work in pairs using their senses—especially touch—to learn more about individual trees.
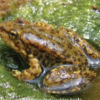
North American Endangered Amphibians Card Game
Source Institutions
In this activity, learners can play two card games related to endangered species, specifically North American amphibians.
Light Bulb Challenge
Source Institutions
In this activity, learners explore the difference between compact fluorescent light (CFL) bulbs and traditional incandescent bulbs.

The Dead Zone: A Marine Horror Story
Source Institutions
In this environmental science and data analysis activity, learners work in groups to track a Dead Zone (decreased dissolved oxygen content of a body of water) using water quality data from the Nutrien
Without An Ark: The Effects of Storms and Floods
Source Institutions
April showers bring May flowers, but what do coastal storms bring?

Sustainable Grazing
Source Institutions
In this activity, learners investigate the food, water, and space needs of common livestock animals.