Search Results
Showing results 101 to 120 of 217
Modeling the Night Sky
Source Institutions
In this two-part activity, learners explore the Earth and Sun's positions in relation to the constellations of the ecliptic with a small model.

Exploring the Solar System: Pocket Solar System
Source Institutions
“Exploring the Solar System: Pocket Solar System” is a hands-on activity in which visitors make a scale model of the distances between objects in our solar system.

Coral Snapshots: Biodiversity in Marine Protected Areas
Source Institutions
In this data activity, learners analyze data from coral reef snapshots taken by scientists at the Virginia Institute of Marine Science.
To Topo Two
Source Institutions
In this activity, two groups of learners create two separate landform models out of clay (mountains and valleys).
Personal Time Line
Source Institutions
In this activity, learners work in groups to create a time line representing significant moments in their lives.
Locating a Point
Source Institutions
In this activity, learners work in teams to simulate the process used by Global Positioning Systems (GPS) to determine the location of a fallen meteorite in Antarctica.
Buzz Lightyear Connect It!: Flight Path Activity
Source Institutions
In this activity, "space cadets" (learners) use writing and sequencing skills in addition to directional words/ordered pairs to guide Buzz Lightyear (from the movie "Toy Story") through a grid to reac
Globe at Night
Source Institutions
In this international citizen science activity, learners measure their night sky brightness and submit their observations into an online database.
Does Air Weigh Anything?
Source Institutions
The demonstration/experiment provides quick proof that air has mass.
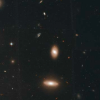
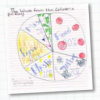
Coma Cluster of Galaxies
Source Institutions
In this activity, learners will first learn the basics of galaxy classification and grouping.
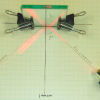
Mirror, Mirror
Source Institutions
In this activity, learners test the Law of Reflection based on experimental evidence. Learners produce raw data and explanations based on their data: pencil tracings of incident and reflection rays.
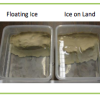
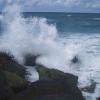
Sea Level: On The Rise
Source Institutions
Learners will understand the relationship between climate change and sea-level rise.
Candy Chemosynthesis
Source Institutions
In this activity, groups of learners work together to create edible models of chemicals involved in autotrophic nutrition.

What's the Difference between Weather and Climate?
Source Institutions
In this interactive and informative group activity, learners use packages of M&M's to illustrate the difference between weather and climate.
Launch Altitude Tracker
Source Institutions
In this activity, learners construct hand-held altitude trackers. The device is a sighting tube with a marked water level that permits measurement of the inclination of the tube.
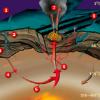
Modeling Tidal Action
Source Institutions
In this activity (Lesson 1), learners work in groups to create tide simulations.
Fish Eyes: More than Meets the Eye
Source Institutions
In this data collection and analysis activity, learners evaluate fish physiology and ecology using vision research data from Dr.
Going Green
Source Institutions
In this activity, learners conduct a waste audit and use their findings to implement a plan for reducing trash.
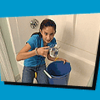
Shower Estimation
Source Institutions
In this activity, learners calculate their water usage (in cups and galloons) during an average shower. Learners also chart and analyze water usage during showers in their households.
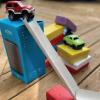
Ramp it Up
Source Institutions
In this activity, learners will build ramps and test how the laws of physics apply do different objects. Learners will explore physics and cause and effect through this activity.