Search Results
Showing results 1 to 20 of 20
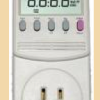
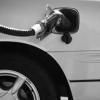
Plugged in to CO2
Source Institutions
In this activity, learners investigate various appliances and electronics, discovering how much energy each uses and how much carbon dioxide (CO2) is released to produce that energy.
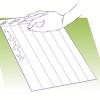
Measuring Your Blind Spot
Source Institutions
In this activity, learners calculate the width (horizontal diameter) of the blind spot on their retina. Learners make a blind spot tester using a piece of notebook paper.
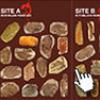
Prehistoric Climate Change
Source Institutions
In this online interactive, learners use fossils to infer temperatures 55 million years ago, at the sites where the fossils were found.

Your Energy Needs
Source Institutions
In this activity about the relationship between food and energy (page 8 of PDF), learners estimate average daily baseline energy (Calorie) needs and energy needs for different levels of activity.
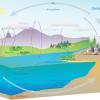
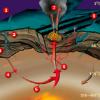
The Carbon Cycle and its Role in Climate Change: Activity 1
Source Institutions
In this activity (on page 1), learners role play as atoms to explore how atoms can be rearranged to make different materials.

Three Circles of Pigments
Source Institutions
In this activity, learners overlap the three primary colors to see how all other colors are made.
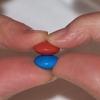
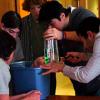
Candy Chemosynthesis
Source Institutions
In this activity, groups of learners work together to create edible models of chemicals involved in autotrophic nutrition.
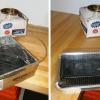
Solar Water Heater
Learners work in teams to design and build solar water heating devices that mimic those used in residences to capture energy in the form of solar radiation and convert it to thermal energy.
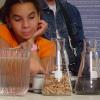
Burn a Peanut
Source Institutions
In this activity, learners burn a peanut, which produces a flame that can be used to boil away water and count the calories contained in the peanut.
Survival of the Fittest: Battling Beetles
Source Institutions
This guided inquiry three-part activity engages learners in thinking about the mechanism of natural selection through data collection and pattern recognition.

Exponential Models: Rhinos and M&M’s ®
Source Institutions
In this math lesson, learners model exponential decay and exponential growth using M&M's, paper folding, and African rhino population data.
Automotive Emissions and the Greenhouse Effect
Source Institutions
In this activity about global climate change, learners will conduct an experiment and collect data to compare the amount of carbon dioxide (CO2) in four different sources of gases.
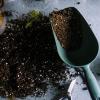
Super Soaking Materials
Source Institutions
In this activity, learners will test cups full of potting soil, sand, and sphagnum moss to see which earth material is able to soak up the most water.
Super Soaker
Source Institutions
In this activity (page 1 of the PDF under SciGirls Activity: Bogs), learners will test cups full of potting soil, sand, and sphagnum moss to see which earth material is able to soak up the most water.

Oil Spot Photometer
Source Institutions
In this math activity related to light, learners assemble a photometer and use it to estimate the power output of the Sun.
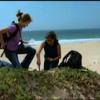
Sand Dunes
Source Institutions
This outdoor activity (on page 2 of the PDF under SciGirls Activity: Sand Dunes) is a full inquiry investigation into how the amount of moisture in a sand dune relates to the number of plants growing
Off Base
Source Institutions
In this activity, learners explore the factors that tend to resist changes in pH of the ocean and why the ocean is becoming more acidic.
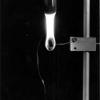
Total Internal Reflection
Source Institutions
In this activity, learners use a laser pointer, empty soda bottle, rubber plug and water to demonstrate total internal reflection.
Sea Turtle Populations
Source Institutions
In this activity (on page 2 of PDF under GPS: Sea Turtles Activity), learners will model how a sea turtle population changes over time, from eggs to adults, using puffed rice.