Search Results
Showing results 1 to 15 of 15
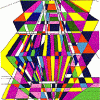
Pósteres de Creatividad y Matemáticas
Source Institutions
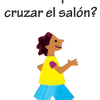
Exponga estos pósteres en el salón o déjelos donde los chicos los puedan explorar. Los chicos buscan las respuestas en libros de consulta, explorando el salón, y usando su creatividad.
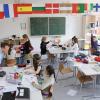
Momentos de Mixing in Math: Varias Actividades Matemáticas de 5 ó 10 Minutos
Source Institutions
Los Momentos de Mixing in Math son actividades de 5 a 10 minutos que mantienen a los chicos ocupados, aprendiendo sobre el mundo, y usando matemáticas por su cuenta.
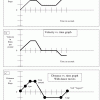
Graph Dance
Source Institutions
In this activity, learners "dance" (move back and forth at varying speeds) by reading a graph. This is a kinesthetic way to help learners interpret and understand how motion is graphed.
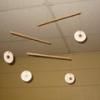
Rotational Equilibrium
Source Institutions
In this activity, learners explore the concept of rotational equilibrium. Learners work in teams to estimate and determine the force within a mobile design.
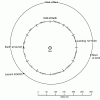
Getting There!: Navigation and Trajectory
Source Institutions
In this two-part activity, learners map a navigation plan to get from Earth to Mars and back. In activity one, learners represent the orbital paths of Earth through dance and dramatic movement.
Our Sense of Sight: Color Vision
Source Institutions
In this activity, learners investigate color vision as well as plan and conduct their own experiments.
Mapping the Classroom
Source Institutions
In this activity, learners discover the importance of maps and scale as they work together to create a map of the classroom.
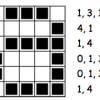
Colour by Numbers: Image Representation
Source Institutions
This activity shows learners how computers use numbers to represent pictures. A grid is used to represent the pixels (short for picture elements) of a computer screen.
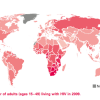
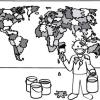
Mapping the Spread of HIV/AIDS: Trailing the Pandemic
Source Institutions
In this activity, learners act as epidemiologists by mapping the prevalence of HIV/AIDS worldwide.
The Poor Cartographer: Graph Coloring
Source Institutions
In this activity, learners help a poor cartographer color in the countries on a map, making sure each country is colored a different color than any of its neighbors.
Sound Representation: Modems Unplugged
Source Institutions
In this activity, learners listen to songs and decode hidden messages based on the same principle as a modem. As a final challenge, learners decode the binary messages in a music video.
Genetics the Easy Way
Source Institutions
In this activity, learners make critters out of recyclables and apply the rules of mathematics to solve genetics problems.
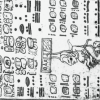
Breaking the Code: Mayan Math
Source Institutions
This is a lesson plan for an activity in which learners, playing the role of archeologists, use math concepts about number bases to decipher the Dresden Codex, an ancient Mayan document.

Arctic Sea Ice
Source Institutions
In this activity, learners explore how the area of Arctic sea ice has changed over recent years. First, learners graph the area of Arctic sea ice over time from 1979 to 2007.
Evolutionstechnik or Selection and Variation in the Egyptian Origami Bird (Avis papyrus)
Source Institutions
In order to examine the random nature of mutations and natural selection, learners "breed" clutches of Egyptian Origami Birds (Avis papyrus) using random number generators (dice and coins) to mutate s