Search Results
Showing results 1 to 20 of 21
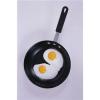
Energy Sources
Source Institutions
In this activity about the relationship between food and energy (page 5 of PDF), learners conduct an experiment to compare how much energy is released as heat from two different foods.
Energy For Life
Source Institutions
In this activity about the relationship between food and energy (page 1 of PDF), learners observe and quantify the growth of yeast when it is given table sugar as a food source.
Biochemistry Happens Inside of You!
Source Institutions
In this four-part activity, learners explore how the body works and the chemistry that happens inside living things.
Servings and Choices
Source Institutions
In this nutrition activity (page 16 of PDF), learners document their individual eating habits and learn whether their eating patterns meet their needs.
Cabbage Juice Indicator
Source Institutions
In this chemistry activity, learners make indicator solution from red cabbage. Then, learners test everyday foods and household substances using the cabbage juice indicator.
Your Energy Needs
Source Institutions
In this activity about the relationship between food and energy (page 8 of PDF), learners estimate average daily baseline energy (Calorie) needs and energy needs for different levels of activity.
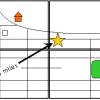
Solar System in My Neighborhood
Source Institutions
In this activity, learners shrink the scale of the vast solar system to the size of their neighborhood.
Sweetly Balanced Equations
Source Institutions
In this (edible) activity, learners balance chemical equations using different kinds and colors of candy that represent different atoms. Learners will work in pairs and explore conservation of atoms.
Fill it to Capacity
Source Institutions
In this math lesson, learners rotate through six estimating and measuring centers. First, learners read the book, "Room for Ripley" by Stuart J.
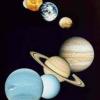
The Thousand-Yard Model
Source Institutions
This is a classic exercise for visualizing the scale of the Solar System.
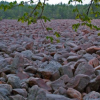
How Boulders Are Born
Source Institutions
In this activity, learners review and discuss weathering, erosion and mass wasting, to gain a stronger understanding of how Hickory Run’s Boulder Field was formed after the Laurentide Continental Glac
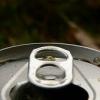
Having a Gas with Cola
Source Institutions
In this activity, learners measure the amount of carbon dioxide in a carbonated drink.

Multi-Variable Relations: Stressed to the Breaking Point
Source Institutions
In this math lesson, learners explore the relationship between the thickness of a spaghetti bridge, the length of the bridge, and the amount of weight that can be supported by the bridge.
Why Circulate?
Source Institutions
In this activity related to the human circulatory system (on page 10 of the PDF), learners observe the dispersion of a drop of food coloring in water, draw conclusions about the movement of dissolved
Boats Afloat
Source Institutions
In this water activity, learners build boats that float and sink. First, learners listen to the book, "Who Sank the Boat" and practice making predictions throughout the story.
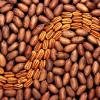
Pea Brain!: Explorations in Estimation
Source Institutions
In this activity, learners use two different techniques to estimate how many little things fit into one bigger thing.
Neural Network Signals
Source Institutions
In this activity, learners create an electrical circuit and investigate how some dissolved substances conduct electricity.

Avogadro's Bubbly Adventure
Source Institutions
In this activity on page 7 of the PDF, learners investigate the solubility of gas in water at different temperatures. This experiment will help learners determine if temperature affects solubility.
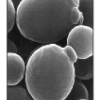
Hot Stuff!
Source Institutions
In this activity, learners discover that sand is the major ingredient in glass.

Mapping Sea Level Rise
Source Institutions
In this activity related to climate change, learners create and explore topographical maps as a means of studying sea level rise.