Search Results
Showing results 1 to 20 of 40
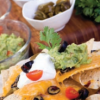
Serving Sizes
Source Institutions
In this nutrition and estimation activity (page 12 of PDF), learners estimate serving sizes of different foods and compare their estimates to serving size information provided on nutrition food labels
Read the Label: Nutrition and Percentage
Source Institutions
This activity combines learning about nutrition, math of measurement and proportion, and healthy eating. Start by distributing food packages with Nutrition Facts labeled.
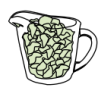
Many Seeds: Estimating Hidden Seeds
Source Institutions
In this activity, learners will estimate how many seeds are in a fruit or vegetable, then count to find out. The result: mix estimation with healthy eating.
Fair Shares: Predict Equal Shares
Source Institutions
Use this activity to build division and number sense into any snack time or whenever there is a limited set of things to share among a group: If we deal these out, could everyone get two pieces?

Nutritional Challenges
Source Institutions
In this nutrition activity (page 26 of PDF), learners consider the nutritional needs of people with specific dietary requirements, such as athletes, persons with diabetes and vegetarians, and create a
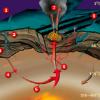
Candy Chemosynthesis
Source Institutions
In this activity, groups of learners work together to create edible models of chemicals involved in autotrophic nutrition.
The Menu Game at the Terribly Terrific Taco
Source Institutions
In this math game (Page 15 of the Dining Out! PDF), learners figure discounts and/or profit increases for various food totals. Learners add decimals to $100.
Servings and Choices
Source Institutions
In this nutrition activity (page 16 of PDF), learners document their individual eating habits and learn whether their eating patterns meet their needs.
Do Plants Need Light?
Source Institutions
In this food science activity, learners conduct an experiment that demonstrates the importance of light to plants.
Dunking the Planets
Source Institutions
In this demonstration, learners compare the relative sizes and masses of scale models of the planets as represented by fruits and other foods.
Solar System in My Neighborhood
Source Institutions
In this activity, learners shrink the scale of the vast solar system to the size of their neighborhood.

Create a Pasta Population Map
Source Institutions
Learners work as a group to create a map of their community. They use pasta to represent people, and glue the pasta on their maps to show areas of large population.
Number Sense and Computation: To Half or Half Not
Source Institutions
In this math lesson, learners use slices of bread and geoboards to explore several ways to divide a rectangle in half. Learners also identify equivalent fractions that represent one-half.
Starburst® Graph
Source Institutions
In this activity, learners use Starburst® candy to sort, classify, compare, and graph. Learners grab a handful of one-inch candy squares, sort them by color, graph the candy, and discuss the results.

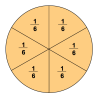
The Gator Pie Game
Source Institutions
In this activity, learners explore fractions as they help gators share pies.
Measuring Rules
Source Institutions
In this math activity, learners create their own units of measurement by making noodle rulers. Learners practice estimating and measuring objects using the noodle rulers .
Breakfast Sweets
Source Institutions
In this math activity, learners guess which cereals contain the most sugar. Learners use the nutrition labels on the cereal boxes to find the cereal with the least amount of sugar.

What's the Difference between Weather and Climate?
Source Institutions
In this interactive and informative group activity, learners use packages of M&M's to illustrate the difference between weather and climate.

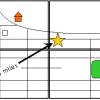
Work Up An Appetite
Source Institutions
In this activity, learners participate in fun movement activities while playing on a giant game board. Use this activity to get learners involved in physical activity.
M&M® Model of the Atom: Edible Subatomic Particles
Source Institutions
In this activity, learners use colored candy to represent subatomic particles and make a model of an atom (Bohr model).