Search Results
Showing results 1 to 20 of 36
Serving Sizes
Source Institutions
In this nutrition and estimation activity (page 12 of PDF), learners estimate serving sizes of different foods and compare their estimates to serving size information provided on nutrition food labels
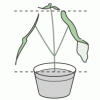
Ripening of Fruits and Vegetables
Source Institutions
In this activity, learners test the rate of ripening fruit and vegetables and use a chemical to inhibit the ripening process.

Nutritional Challenges
Source Institutions
In this nutrition activity (page 26 of PDF), learners consider the nutritional needs of people with specific dietary requirements, such as athletes, persons with diabetes and vegetarians, and create a

Sustainable Grazing
Source Institutions
In this activity, learners investigate the food, water, and space needs of common livestock animals.
Number Sense and Computation: Food For Thought
Source Institutions
In this math lesson, learners identify and compare unit costs of given items. Learners use computation skills, problem solving and number sense to find the cost of an ounce of cereal.
Servings and Choices
Source Institutions
In this nutrition activity (page 16 of PDF), learners document their individual eating habits and learn whether their eating patterns meet their needs.
Do Plants Need Light?
Source Institutions
In this food science activity, learners conduct an experiment that demonstrates the importance of light to plants.
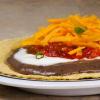
Creating Tostadas
Source Institutions
In this activity, learners develop their understanding of combinations as they create as many different kinds of tostadas as possible.
Your Energy Needs
Source Institutions
In this activity about the relationship between food and energy (page 8 of PDF), learners estimate average daily baseline energy (Calorie) needs and energy needs for different levels of activity.

Create a Pasta Population Map
Source Institutions
Learners work as a group to create a map of their community. They use pasta to represent people, and glue the pasta on their maps to show areas of large population.
Starburst® Graph
Source Institutions
In this activity, learners use Starburst® candy to sort, classify, compare, and graph. Learners grab a handful of one-inch candy squares, sort them by color, graph the candy, and discuss the results.
Measuring Rules
Source Institutions
In this math activity, learners create their own units of measurement by making noodle rulers. Learners practice estimating and measuring objects using the noodle rulers .

Mold Growth
Source Institutions
In this activity learners observe mold growth on different types of bread by measuring and recording the growth rate.

Bake Sale
Source Institutions
This activity helps learners learn about math through a real-world scenario. Three friends are baking cookies for their school’s bake sale.

The Snack Shop
Source Institutions
In this math activity (Page 11 of the Dining Out! PDF), younger learners count out the total amount of money needed to purchase trail mix using the fewest number of bills/coins possible.

Exponential Models: Rhinos and M&M’s ®
Source Institutions
In this math lesson, learners model exponential decay and exponential growth using M&M's, paper folding, and African rhino population data.

Multi-Variable Relations: Stressed to the Breaking Point
Source Institutions
In this math lesson, learners explore the relationship between the thickness of a spaghetti bridge, the length of the bridge, and the amount of weight that can be supported by the bridge.
Ship the Chip
Source Institutions
In this activity, learners explore engineering package designs that meet the needs of safely shipping a product.
Not Just A Bag Of Beans
Source Institutions
In this activity, learners count and measure kidney beans to explore natural selection and variation. Learners measure the length of 50-100 beans.

Mix It Up
Source Institutions
In this math lesson, learners are introduced to proportional reasoning through modeling, sharing, and questioning techniques.