Search Results
Showing results 1 to 20 of 28
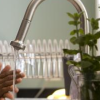
Home Water Audit
Source Institutions
This activity offers learners and their families several ways to raise their awareness together about home water.

Heat Capacity: Can't Take the Heat?
Source Institutions
Why is ocean water sometimes the warmest when the average daily air temperature starts to drop? In this activity, learners explore the differing heat capacities of water and air using real data.
Conductivity: Salty Water
Source Institutions
Water, whether fresh or salty, serves as one of the best electrical conductors on the planet. Does salt effect its conductivity?
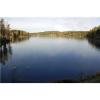
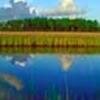
Water Walk
Source Institutions
Learners take a field trip along a local body of water and conduct a visual survey to discover information about local land use and water quality.
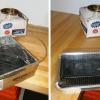
Solar Water Heater
Learners work in teams to design and build solar water heating devices that mimic those used in residences to capture energy in the form of solar radiation and convert it to thermal energy.
Determining the Amount of Transpiration from a Schoolyard Tree
Source Institutions
In this activity, learners calculate the number of milliliters of water a nearby tree transpires per day.
Rates of Change: Bottles and Divers
Source Institutions
In this math lesson (page 2 of the PDF), learners use bottles of various shapes to explore the abstract concept of rate of change.
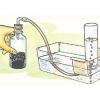
Pneumatic Trough
Source Institutions
In this activity, learners build a "pneumatic trough," a laboratory apparatus used for collecting pure gas samples over water.

Measure the Pressure: The "Wet" Barometer
Source Institutions
In this activity, learners use simple items to construct a device for indicating air pressure changes.
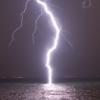
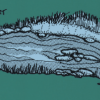
Without An Ark: The Effects of Storms and Floods
Source Institutions
April showers bring May flowers, but what do coastal storms bring?
Mystery Sand
Source Institutions
In this activity, learners play with surprising sand that doesn’t get wet! Learners explore how water behaves differently when it comes in contact with "magic sand" and regular sand.
Human Impact on Estuaries: A Terrible Spill in Grand Bay
Source Institutions
In this activity, learners make a model of a pollution spill that occurred at Bangs Lake in Mississippi and measure water quality parameters in their model.
Great Steamboat Race
Source Institutions
In this outdoor activity, learners race small boats, made of cork, balsa wood, popsicle sticks etc., to investigate the rate and direction of currents in a stream or creek.
Making An Impact!
Source Institutions
In this activity (on page 14 of PDF), learners use a pan full of flour and some rocks to create a moonscape.

The Dead Zone: A Marine Horror Story
Source Institutions
In this environmental science and data analysis activity, learners work in groups to track a Dead Zone (decreased dissolved oxygen content of a body of water) using water quality data from the Nutrien

Earth Atmosphere Composition
Source Institutions
In this activity, learners use rice grains to model the composition of the atmosphere of the Earth today and in 1880. Learners assemble the model while measuring percentages.
Total Internal Reflection
Source Institutions
In this activity, learners use a laser pointer, empty soda bottle, rubber plug and water to demonstrate total internal reflection.
Plot the Dot: A Graphical Approach to Density
Source Institutions
In this activity, learners work in groups to determine the mass and volume of four samples: glass marbles, steel washers or nuts, pieces of pine wood, and pieces of PVC pipe.
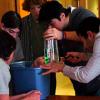
Linear Functions: Mystery Liquids
Source Institutions
In this math lesson, learners analyze the density of liquids in order to explore linear functions.
Launch Altitude Tracker
Source Institutions
In this activity, learners construct hand-held altitude trackers. The device is a sighting tube with a marked water level that permits measurement of the inclination of the tube.