Search Results
Showing results 1 to 20 of 23

Heat Capacity: Can't Take the Heat?
Source Institutions
Why is ocean water sometimes the warmest when the average daily air temperature starts to drop? In this activity, learners explore the differing heat capacities of water and air using real data.
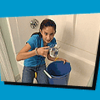
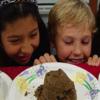
Shower Estimation
Source Institutions
In this activity, learners calculate their water usage (in cups and galloons) during an average shower. Learners also chart and analyze water usage during showers in their households.
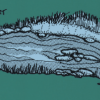
Making Rivers
Source Institutions
In this outdoor water activity, learners explore how to change the direction of water flow. Learners make puddles in dirt or use existing puddles and sticks to make water flow.
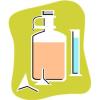
Rates of Change: Bottles and Divers
Source Institutions
In this math lesson (page 2 of the PDF), learners use bottles of various shapes to explore the abstract concept of rate of change.
OBIS Oil Spill
Source Institutions
In this outdoor activity, learners simulate an oil spill using popcorn (both oil and popcorn float on water), and estimate the spill's impact on the environment.
Boats Afloat
Source Institutions
In this water activity, learners build boats that float and sink. First, learners listen to the book, "Who Sank the Boat" and practice making predictions throughout the story.
Patterns and Functions: Fill 'er Up
Source Institutions
In this math lesson, learners predict, interpret, and sketch graphs of functions related to the shapes of bottles. A measure of water is poured into a container.
Sand Castle Saturation
Source Institutions
In this activity about saturation (page 1 of PDF under SciGirls Activity: Sand Dunes), learners will build a series of sand castle towers using a 16 oz cup.
Drip, Drop, Drip, Drop
Source Institutions
In this math lesson, learners design an experiment to model a leaky faucet and determine the amount of water wasted due to the leak.
Great Steamboat Race
Source Institutions
In this outdoor activity, learners race small boats, made of cork, balsa wood, popsicle sticks etc., to investigate the rate and direction of currents in a stream or creek.
The Shape of Floatation
Source Institutions
In this activity (on page 2 of the PDF under GPS: Sailboat Design Activity), learners will discover how the shape of an object, not just its weight, determines whether it floats or sinks.
Float My Boat
Source Institutions
In this activity, learners use tinfoil to build and test their own boats - which designs will float, and which will sink?
Plot the Dot: A Graphical Approach to Density
Source Institutions
In this activity, learners work in groups to determine the mass and volume of four samples: glass marbles, steel washers or nuts, pieces of pine wood, and pieces of PVC pipe.
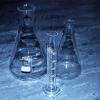
Linear Functions: Mystery Liquids
Source Institutions
In this math lesson, learners analyze the density of liquids in order to explore linear functions.
Tools of Magnification
Source Institutions
In this activity related to microbes, learners use water drops and hand lenses to begin the exploration of magnification. This activity also introduces learners to the microscope.
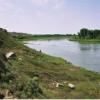
Mystery of the Disappearing Cottonwoods
Source Institutions
Learners will explore the scientific mystery behind a disappearing group of trees by examining data and attempting to explain the decline.
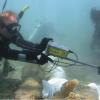
Excavating and Mapping Under Water
Source Institutions
In this archaeology activity, learners consider ways in which excavating an underwater site is different from excavating a terrestrial site.
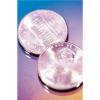
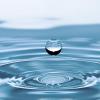
Statistics: Wet Heads
Source Institutions
In this math lesson, learners learn how to construct stem and leaf plots. Learners first estimate the number of drops of water that will fit on the head of a penny.
Number Sense and Computation: Soak It Up
Source Institutions
In this math lesson, learners compare products to determine the best product.
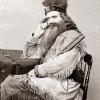
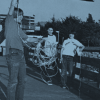
Mountain Man Measurement Rendezvous
Source Institutions
In this math lesson, learners participate in several activities where they apply measurement skills.