Search Results
Showing results 1 to 20 of 55
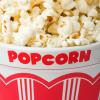
Buckets of Popcorn
Source Institutions
In this activity, learners develop an understanding of cylinders and volume as they compare two sizes of popcorn buckets.
Measuring Rules
Source Institutions
In this math activity, learners create their own units of measurement by making noodle rulers. Learners practice estimating and measuring objects using the noodle rulers .
Toxic Popcorn Design Challenge
Source Institutions
In this activity, learners explore the engineering design process (EDP)—the process engineers use to solve design challenges.

Mold Growth
Source Institutions
In this activity learners observe mold growth on different types of bread by measuring and recording the growth rate.
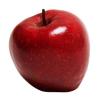
An Apple as Planet Earth
Source Institutions
In this environmental education demonstration (page 6 of the PDF), learners will see a tangible representation of the scarcity of soil resources on earth.
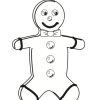
Eatem Up
Source Institutions
In this math activity, learners use gingerbread cookies to collect and organize simple data. First, learners read "The Gingerbread Boy" by Paul Galdone.

The Scoop on Scallops
Source Institutions
In this data analysis activity, learners quantify the abundance and distribution of sea scallops in and adjacent to the Mid-Atlantic closed areas.
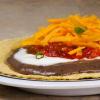
Creating Tostadas
Source Institutions
In this activity, learners develop their understanding of combinations as they create as many different kinds of tostadas as possible.
Starburst® Graph
Source Institutions
In this activity, learners use Starburst® candy to sort, classify, compare, and graph. Learners grab a handful of one-inch candy squares, sort them by color, graph the candy, and discuss the results.
Ripening of Fruits and Vegetables
Source Institutions
In this activity, learners test the rate of ripening fruit and vegetables and use a chemical to inhibit the ripening process.

Build a Big Wheel
Source Institutions
In this activity, learners explore how engineers have developed big wheels or Ferris wheels.
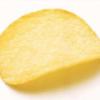
Ship the Chip
Source Institutions
In this activity, learners explore engineering package designs that meet the needs of safely shipping a product.
Serving Sizes
Source Institutions
In this nutrition and estimation activity (page 12 of PDF), learners estimate serving sizes of different foods and compare their estimates to serving size information provided on nutrition food labels
Joe's Place
Source Institutions
In this math activity (Page 8 of the Dining Out! PDF), younger learners select items from a menu and count out the total amount needed using the fewest bills and coins possible.

Bake Sale
Source Institutions
This activity helps learners learn about math through a real-world scenario. Three friends are baking cookies for their school’s bake sale.
Making Connections: What You Can Do To Help Stop Global Climate Change
Source Institutions
In this cooperative learning activity, learners visit ten stations and are challenged to think critically about various conservation questions and issues.

Mapping Sea Level Rise
Source Institutions
In this activity related to climate change, learners create and explore topographical maps as a means of studying sea level rise.
The Menu Game at the Terribly Terrific Taco
Source Institutions
In this math game (Page 15 of the Dining Out! PDF), learners figure discounts and/or profit increases for various food totals. Learners add decimals to $100.

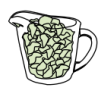
The Snack Shop
Source Institutions
In this math activity (Page 11 of the Dining Out! PDF), younger learners count out the total amount of money needed to purchase trail mix using the fewest number of bills/coins possible.
Exploring at the Nanoscale
Source Institutions
This lesson focuses on how nanotechnology has impacted our society and how engineers have learned to explore the world at the nanoscale.